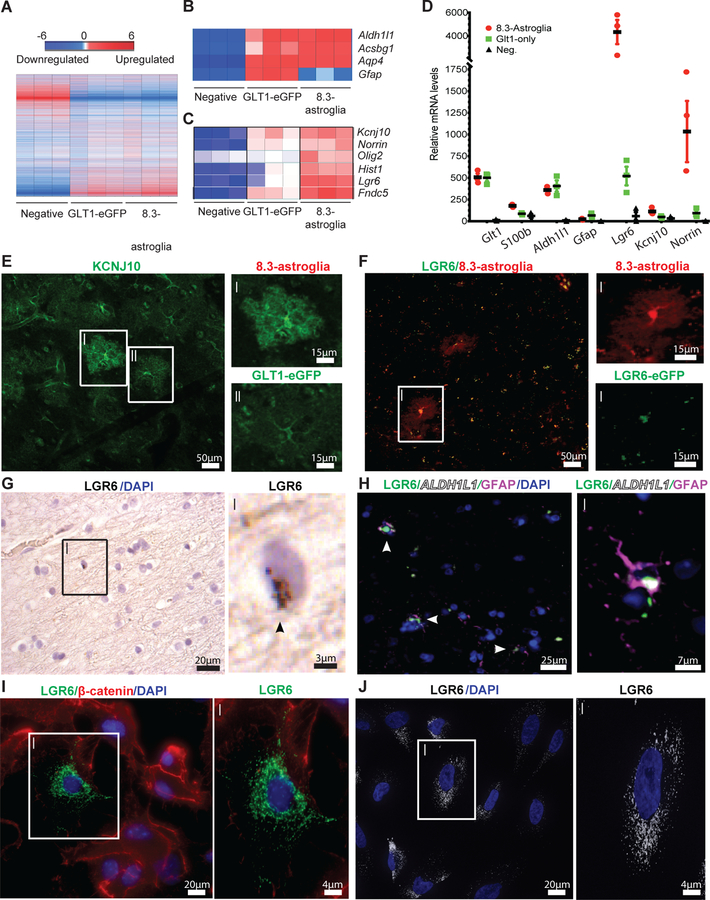
Fig. 3. Astroglial cell populations isolated from 8.3-astroglia mouse CNS and human cortex have unique transcriptomes as validated with immunohistochemistry (IHC) and RNA in situ hybridization.
(A) The cortex microarray heatmap displays unique genes differentially expressed between all rodent astroglia (GLT1-eGFP), 8.3 kb labeled astroglia (8.3-astroglia) and remaining non-labeled cells (negative). (B) Microarray expression of astroglia markers highly expressed in both rodent astroglia populations. (C) Selected markers highly enriched in 8.3-astroglia microarray data in the cortex. (D) qPCR validation of candidate markers from the microarray analyses in the cortex of the three cell populations. (E) KCNJ10 enhanced immunoreactivity in 8.3-astroglia compared to GLT1-eGFP astroglia in the mouse motor cortex (i,ii scale bars 15μm). (F) LGR6-GFP expression is restricted to 8.3-astroglia in the adult mouse cortex as evaluated in double transgenic LGR6-GFP-ires-CreERT2/8.3-astroglia mice (i,ii scale bars 15μm). (G) Analysis of Lgr6 mRNA expression in the human motor cortex in a subset of cells (i scale bar 2.5μm), arrow indicates RNA. (H) LGR6 protein in the human motor cortex colocalizes with GFAP and ALDH1L1 protein (i scale bar 7.5μm). (I) A subset of cultured primary mouse cortical astroglia are LGR6-positive (i scale bar 4μm). (J) A subset of cultured and matured human iPSC-astroglia are LGR6-immunoreactive (i scale bar 4μm). Three cell populations were isolated from the adult mouse whole cortex and subjected to FACS, microarray, and qPCR analyses from a total of three mice. For histological sections, n = five mice were imaged with a minimum of 3–5 images per mouse, representative images are shown. Human post-mortem tissue was evaluated in n = three non-neurological diseased cases with at least 3–5 images taken per case for both RNA ISH and immunohistochemistry. For mouse immunocytochemistry, n = five different cultures of mouse primary astroglia were generated and imaged at least 3–5 times per astroglia generation. For iPSC astroglia a minimum of three control human iPSC lines were generated. All images are representative of the total amount imaged. Statistics were performed by two-sided Student’s T-test of 8.3-astroglia vs negative cell population with represented values showing the mean and error bars representing SEM, *p<0.05, **p<0.01, ***p<0.001.

