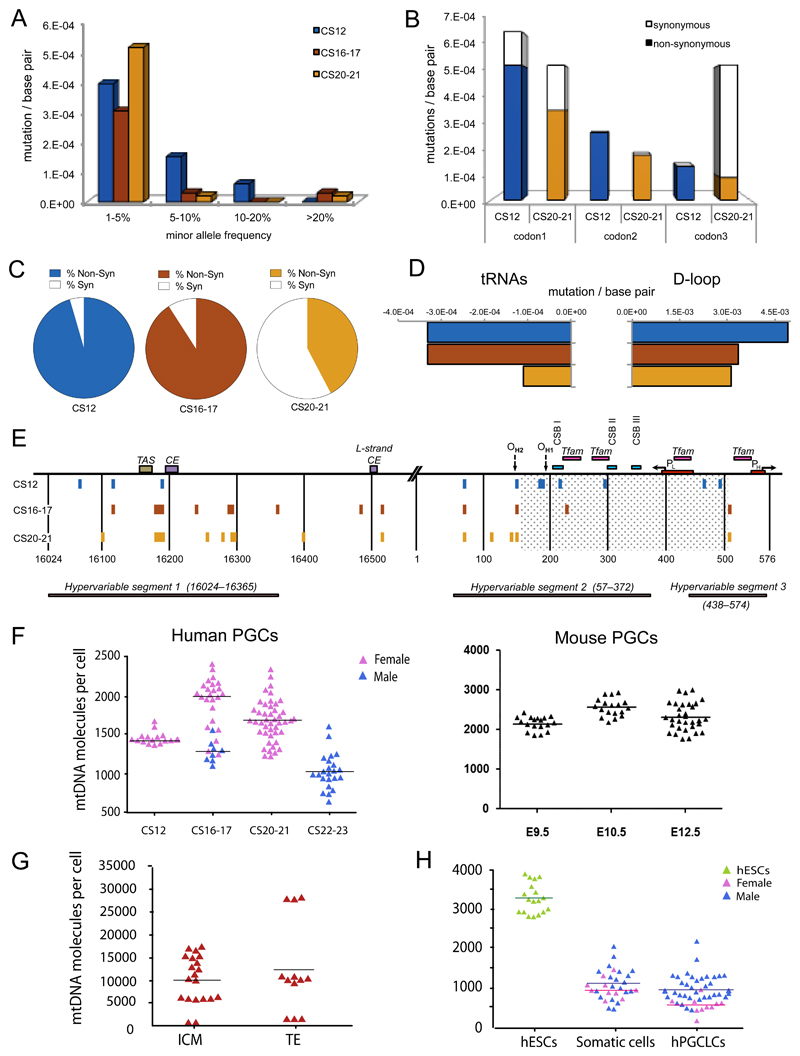
Figure 2. Mitochondrial DNA variants in human primordial germ cells.
(a-e) Mitochondrial DNA (mtDNA) variants exceeding the assay detection threshold (minor allele frequency, MAF) of >1% during human primordial germ cell (PGC) development. Carnegie stage, CS12 = blue, CS16/17 = red, CS20/21 = orange. Data were derived from n=80 single cells sorted from two CS12 embryos, n=240 cells sorted from four CS16/17 embryos, and n=360 cells sorted from six CS20/21 embryos.
(a) Frequency distribution of mtDNA variants at sequential stages of germ line development.
(b) Codon positions affected by the coding region mutations (No codon bias for CS12, P = NS, significant codon bias for CS20/21, P = 0.005, Fisher’s exact text, 2-sided).
(c) Proportion of non-synonymous (shaded) variants and synonymous (open) (dN/dS, P = 0.02, Fisher’s exact text, 2-sided).
(d) Evidence of selection against mtDNA variants in tRNA genes (P=0.03, Fisher’s exact text, 2-sided) and the non-coding Displacement (D)-loop (P = 0.003) between CS12 and CS20/21.
(e) Position of the variants detected in the non-coding mtDNA D-loop region.
(f) MtDNA content of single in vivo PGCs from human (left, n = 117) and Blimp1-mVenus and Stella-eCFP [BVSC] mouse (right, n = 68) embryos. Each data point represents the mtDNA content in a single cell corresponding to the mean value from the independent qPCR measurements.
(g) MtDNA content of single human inner cell mass (ICM, n = 20), trophectoderm (TE, n = 12) cells from five embryos in vivo. Each data point represents the mtDNA content in a single cell corresponding to the mean value from the independent qPCR measurements.
(h) MtDNA content of single human embryonic stem cells (hESCs, n = 18), somatic cells (n = 30), and human primordial germ-cell like cells (hPGCLC, n = 48) isolated in vitro7,21.
Two independent PGCLC inductions were performed for both the male (WIS2) and female (H9) ESC lines, with cells analysed at day 5/6. Each data point represents the mtDNA content in a single cell corresponding to the mean value from the independent qPCR measurements. Horizontal lines in (f-h) represent the mean values.

