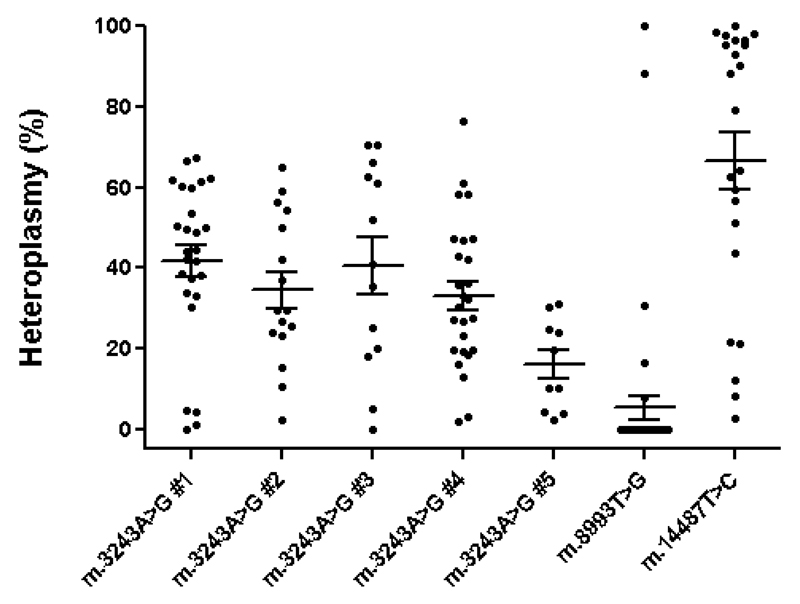
Figure 1.
Distribution of the percentages of m.3243A>G, m.8993T>G and m.14487T>C mutation in surplus oocytes, blastomeres and zygotes from seven different carriers. When multiple blastomeres of a single cleavage stage embryo were analysed, the mutation load plotted for this embryo was the average of these blastomeres. Every dot thus represents the (average) mutation load of a single oocyte, embryo or zygote. Horizontal lines indicate average mutation loads with SEM.

