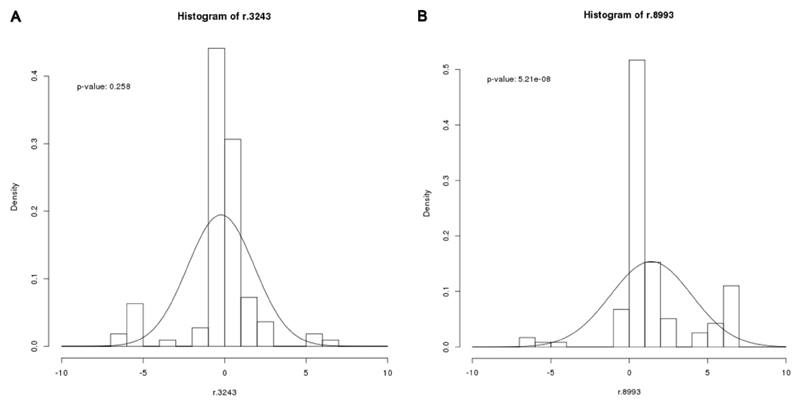
Figure 3.
Frequency histograms of O-M values for m.3243A>G and m.8993T>G transmissions. Heteroplasmy data from blood for mother to child transmissions were compiled from published studies of the m.3243A>G (n=111) and the m.8993T>G mutation (n=118). The blood heteroplasmy for the m.3243A>G mutation was corrected for age to avoid potential bias. O-M values represent the ratio in heteroplasmy between generations (O=offspring, M=mother) of A) m.3243A>G and B) m.8993T>G Frequency. Histograms were plotted for both mutations, and a Gaussian curve fitted to each plot.

