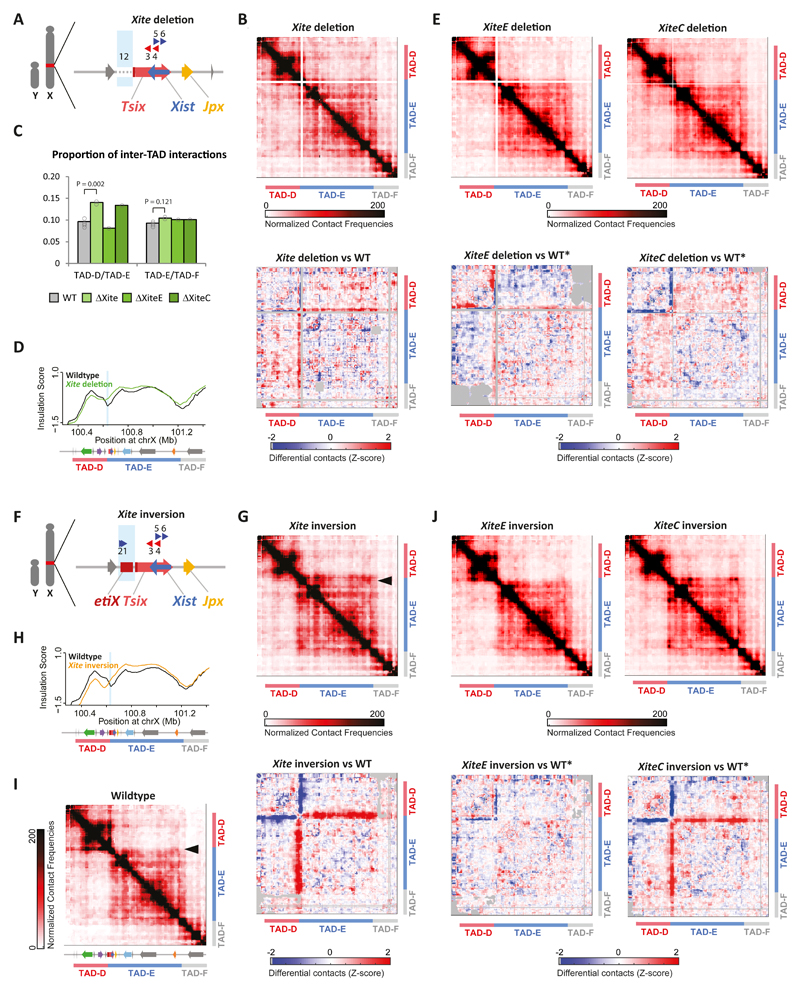
Fig. 3. Xite structural element is important for TAD boundary position and insulation.
(a) Schematic representation of the Xite deletion (ΔXite) in male mESCs. Blue box indicates deleted region. (b) (e) (g) (j) Top: 5C chromosome conformation contact frequencies in ΔXite (b), ΔXiteE (e, left), ΔXiteC (e, right), Xite inversion (g), XiteE inversion (j, left) or XiteC inversion (j, right) male mESCs. Pools of two replicates normalized and binned as in 1C. Bottom: Differential 5C map of mutant versus wild type mESCs. Differential map represents the subtraction of wild type Z-scores from mutant Z-scores (see Methods). Gray pixels correspond to interactions that were filtered because they did not meet the quality control threshold (see Methods). 5C results of ΔXite and Xite inversion for the first clone shown here, second clone shown in Supplementary Figure 3. For other mutants, maps represent pooled results from two independent clones. (c) Quantification of the increased inter-TAD interactions in Xite mutants. Center values represent the average of the calculated proportions: for ΔXiteE and ΔXiteC, two measurements each from two independent clones; for WT and ΔXite, four measurements each from two independent clones in duplicates (see Supplementary Figure 3F for details). Statistical analysis was performed using two-sample, two-tailed heteroscedastic t test. (d) Insulation scores; wild type in black and ΔXite in green. Deleted region represented by light blue box. Insulation score for one clone shown here, second clone can be found in Supplementary Figure 3E. (f) Schematic representation of the Xite inversion in male mESCs. Blue box indicates inverted region. (h) Insulation scores, wild type in black and Xite inversion in orange. Inverted region represented by light blue box. Insulation score for one clone shown here, second clone can be found in Supplementary Figure 3E. (i) 5C chromosome conformation contact frequencies in wildtype male mESCs, as in Figure 1C, included for clarity purposes. Arrowhead indicates interactions at the proximal end of TAD-E.

