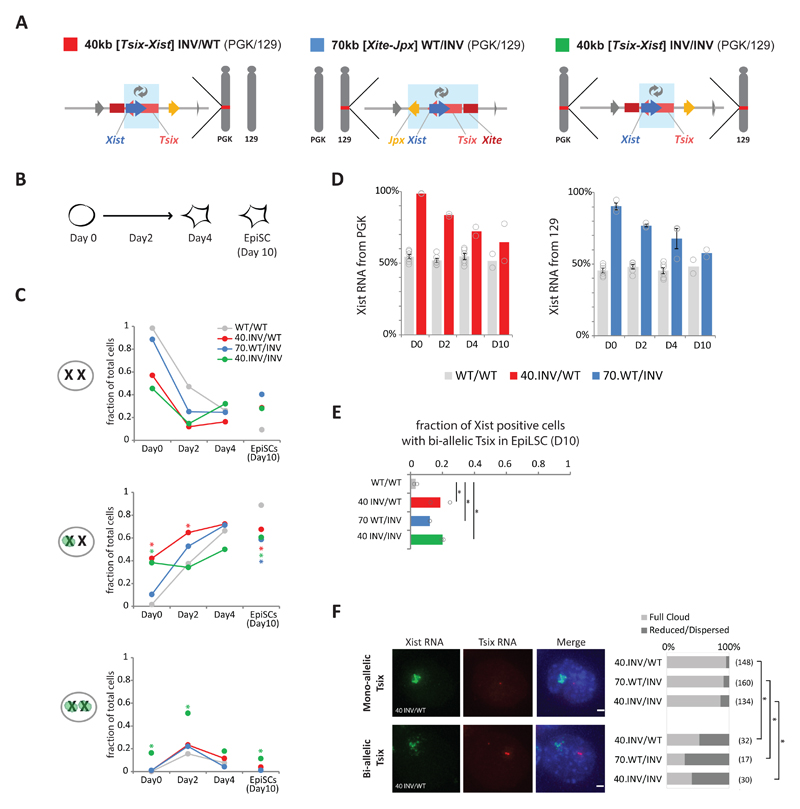
Fig. 5. Xist/Tsix inversions affect the initiation of XCI and the expression dynamics of Xist and Tsix during differentiation of female mESCs.
(a) Schematic representation of female hybrid mESC lines harboring a heterozygous 40-kb [Tsix-Xist] inversion on the PGK chromosome (red), a 70-kb [Xite-Jpx] inversion on the 129 chromosome (blue) and a homozygous 40-kb [Tsix-Xist] inversion (green). Light blue boxes indicate inverted region. (b) Schematic representation of mESC to EpiLSC differentiation and time points analyzed. (c) Xist accumulation analyzed by RNA-FISH in the female cell lines described in A. Bars represent mean fraction of counted cells with an Xist accumulation or cloud at none, one and both X chromosomes. For each cell line, at least two independent experiments were performed, each counting >100 cells (Supplementary Table 6 for number of independent experiments per cell line and exact sample size details). Statistical analysis was performed on independent experiments, using two-sided Fisher’s exact test, mutant versus wild type per time point. * P < 0.05 in all experiments, see Supplementary Table 8 for exact P values. (d) Allelic Xist expression, measured by pyrosequencing of Xist cDNA. Bars represent the percentage of Xist mRNA expressed from the PGK (left) or 129 (right) allele in cells described in A. Bars depict the mean of two or more independent experiments, with dots depicting each experiment, and error bars representing SEM in case of n > 3 (number of independent experiments per line as in C). (e) Bi-allelic Tsix expression measured by RNA FISH in the female cell lines described in A. Bars represent mean fraction of Xist positive cells with bi-allelic Tsix expression. For each cell line, two independent experiments were performed, each counting >100 cells (Supplementary Table 6 for exact sample size details). Dots represent the independent experiments. Statistical analysis was performed on independent experiments, using Pearson's Chi-squared test with Yates' continuity correction: * P ≤ 0.01 in both experiments. See Supplementary Table 8 for exact P values. (f) Quantification of Xist RNA cloud formation in the female cell lines described in A, at day 10 of EpiLSC induction. Typical example of a proper Xist RNA cloud in a 40 INV/WT cell that expresses Tsix RNA from one X chromosome (upper panels). Typical example of a reduced and dispersed Xist RNA cloud formation in a 40 INV/WT cell that expresses Tsix from both X chromosomes (lower panels). Bar plot shows mean percentages of cells with full Xist RNA cloud formation (light gray) and reduced/dispersed Xist RNA cloud formation (dark gray) in Xist-positive cells expressing Tsix RNA from one or neither of the X chromosomes (top bars) or cells expressing Tsix RNA from both X chromosomes (bottom bars). n = two independent experiments, total number of cells in the two experiments per group noted between brackets. Statistical analysis was performed on each independent experiment using two-sided Fisher’s exact test: * P < 0.01 in both experiments. See Supplementary Table 8 for exact P values.

