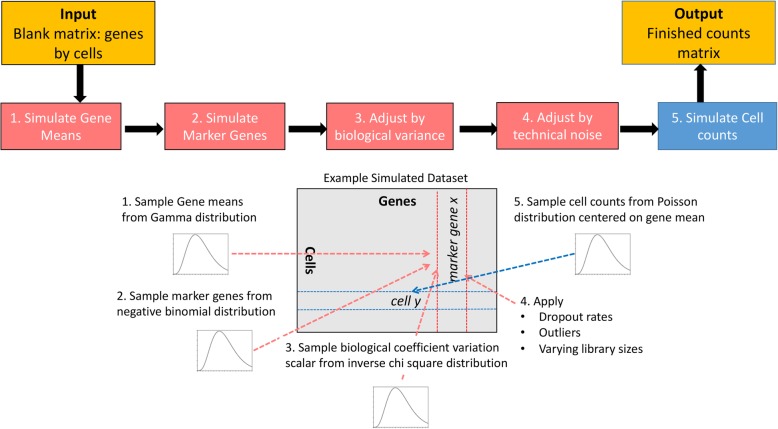
Fig. 2.
Schematic representation showing generation of simulated dataset using SCEED. (Left to right) A blank matrix is provided as an input where initially (1) mean expression of all the genes and (2) number of marker genes at a desired foldchange cutoff are simulated, followed by adjustment of (3) biological and (4) technical noises. Finally, (5) single cell count is simulated and provided as an output matrix

