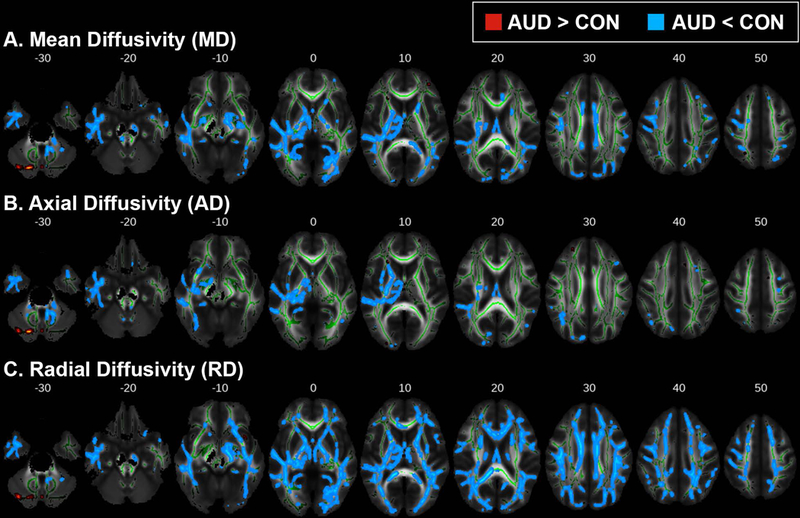
Figure 2.

TBSS results for (A) mean diffusivity (MD), (B) axial diffusivity (AD), and (C) radial diffusivity (RD). Areas where alcohol use disorder (AUD) subjects had either higher (red-yellow) or lower (blue) scalar diffusion measures compared to controls (CON) (pTFCE < 0.05). Group differences are superimposed on the mean FA skeleton (green); the mean FA image of the sample is the underlay. For visualization purposes, significant voxels within the WM skeleton were thickened with tbss_fill.
