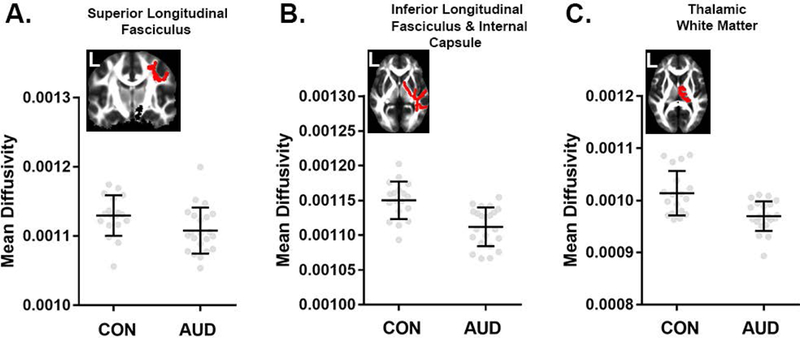
Figure 4.

Comparisons of mean diffusivity (MD) for largest 1% of clusters (> 500 voxels). TBSS results (pTFCE < 0.05) showed reduced MD in portions of the (A) superior longitudinal, (B) inferior longitudinal and internal capsule, as well as (C) thalamic white matter. Mean FA images from the sample show the anatomic position of each cluster in red. Data are mean ± standard deviation (black), with individual data points in gray filled circles. Tract labels were obtained from the Johns Hopkins University white-matter tractography atlas in FSL.
