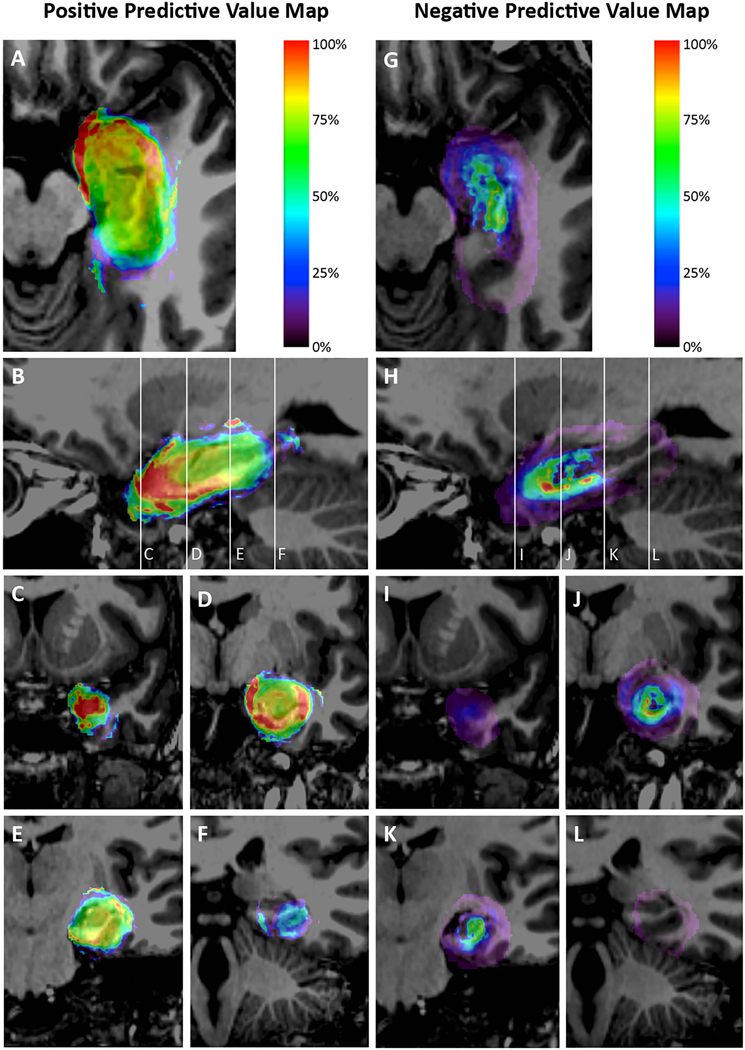
Figure 5 –

Maps representing the positive predictive value (PPV) [A-F] and negative predictive value (NPV) [G-L] of Engel I outcome associated with at least 1-year follow-up for each voxel ablated in normalized atlas space for 175 patients. Panels A and G represent axial views; Panels B and H represent sagittal views; and Panels C-F and I-L represent coronal views through the temporal pole, hippocampal head and posterior amygdala, hippocampal body, and hippocampal tail as represented by the reference lines on the sagittal image. Voxels were assigned a color if it was involved in the ablation of at least 4 patients. Each voxel was analyzed independently. Both maps demonstrate the importance of targeting the anterior, medial, and inferior structures in the mesial temporal lobe. Ablations extending posteriorly beyond the coronal plane in line with the lateral mesencephalic sulcus were less likely to be associated with Engel I outcomes.
