
Figure 3.
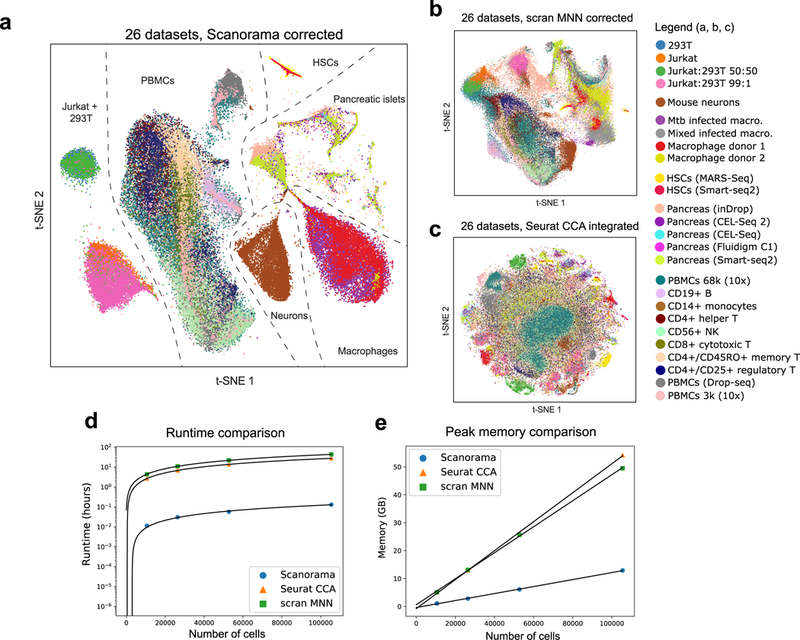
Panoramic integration of 26 single cell datasets across 9 different technologies. (a) t-SNE visualization of 105,476 cells after batch-correction by our method, with cells clustering by cell type instead of by batch (median Silhouette Coefficient of 0.17). (b, c) Other methods for scRNA-seq dataset integration (scran MNN9 and Seurat CCA10) are not designed for heterogeneous dataset integration and therefore naively merge all datasets into a single large cluster (median Silhouette Coefficient of −0.03 for scran MNN and −0.18 for Seurat CCA; Supplementary Fig. 10). (d, e) Scanorama integrates 105,476 cells across 26 datasets in less than 6 minutes and in under 12 GB of RAM, which is substantially more efficient than current methods for scRNA-seq integration.