
Figure 5.
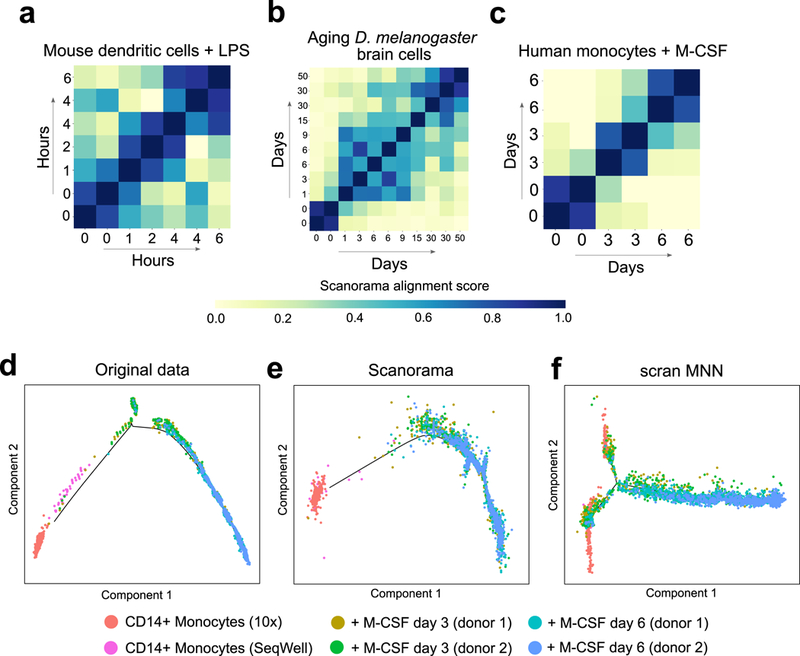
Scanorama is sensitive to subtle transcriptional changes in cellular state over time. (a-c) Heatmap rows and columns correspond to different datasets within the time course study (including replicate datasets at the same timepoint) and diagonal entries are set to 1. Higher alignment scores (darker blue) tend to be close to the diagonal, indicating greater transcriptional similarity between datasets from closer time points. The temporal differences and the alignment scores are significantly correlated in each time series experiment: Spearman correlation of (a) −0.60 (P = 0.0043, n = 42 pairs of time points) for mouse dendritic cells with LPS, (b) −0.49 (P = 1.3e-4, n = 110 pairs of time points) for aging D. melanogaster brain cells, and (c) −0.88 (P = 1.8e-5, n = 30 pairs of timepoints) for monocytes with M-CSF stimulation. (d-f) Scanorama removes batch effects separating CD14+ monocytes obtained by different technologies when visualized according to pseudo-time assigned by the Monocle 2 algorithm. Due to overcorrection, Monocle 2 can no longer identify the main differentiation trajectory after batch correction with scran MNN.