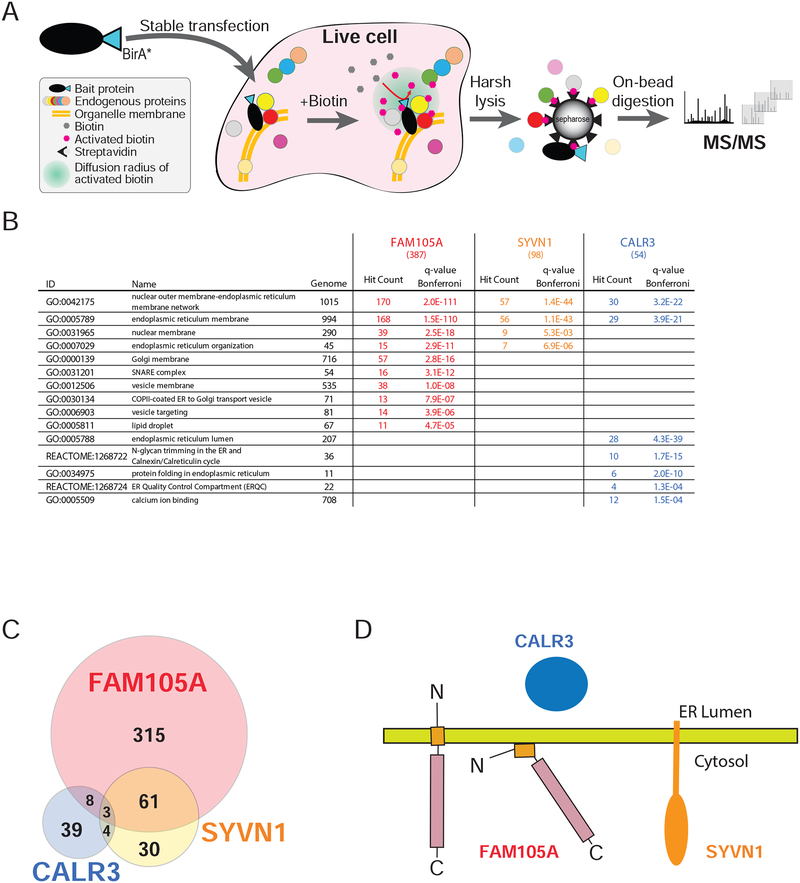
Figure 7. Comparison of FAM105A, SYVN1 (an ER membrane protein), and CALR3 (an ER lumen protein) BioID interactomes.
(A) A C-terminally tagged FAM105A-BirA*FLAG protein (the “bait” polypeptide) was stably expressed in Flp-In T-REx 293 cells. Bait expression was induced with 1μM tetracycline, and 50μM biotin was added to the culture media for 24 hrs, allowing for in vivo biotin labelling of proximal interacting proteins. Cells were lysed and biotinylated polypeptides were captured on a streptavidin column. After washing, bound proteins were subjected to trypsin digestion and the resulting peptides identified using liquid-chromatography (LC) coupled in-line with tandem mass spectrometry (MS/MS). (B) Selected GO or Pathway categories significantly enriched (Bonferroni q-value<0.01) in the FAM105A, SYVN1, and CALR3 BioID interactomes (n.s.: not significant); Genome: number of human genes coding for proteins in the indicated category; Hit count: number of high confidence interactors for the indicated bait protein assigned to each category (total high confidence interactors indicated in brackets at the top of each column); q-value Bonferroni: significance value extracted from ToppGene Suite analysis; Grey font: not significant. (C) Venn diagram depicting the overlap between high confidence interacting partners identified in BioID analyses of FAM105A, SYVN1 and CALR3 (see Supplemental Table 2 and 3 for detailed data and enrichment analysis). (D) Models for FAM105A orientation at the ER membrane and cytosolic interface relative to SYVN1 and CALR3.

