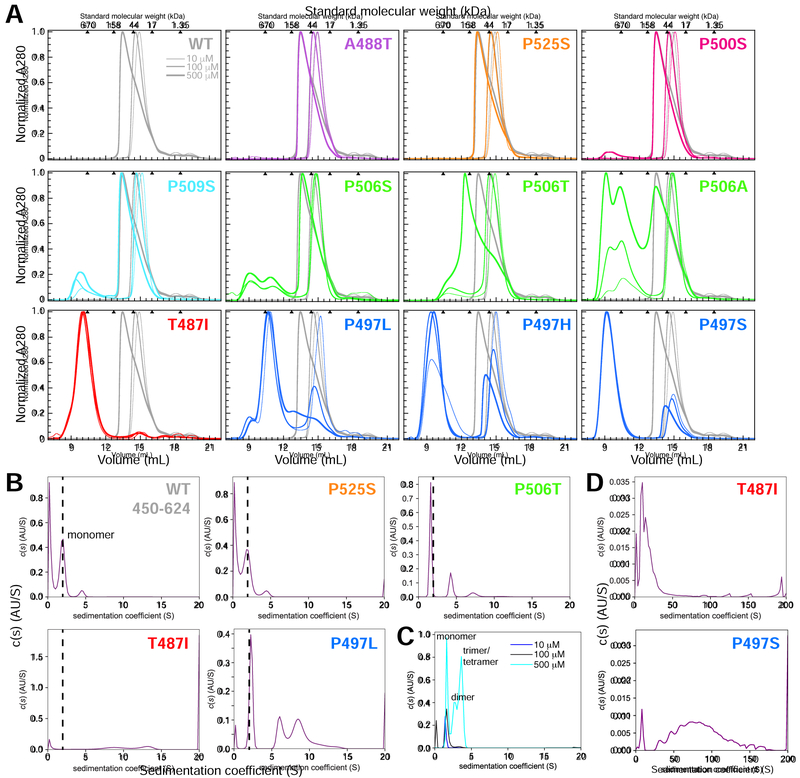
Figure 3. ALS-linked mutations increase UBQLN2 self-assembly/oligomerization.
(A) Representative SEC of UBQLN2 Pxx mutants at 10 μM (thinnest line), 100 μM (medium-thick), and 500 μM (thickest) protein concentrations using buffer containing 20 mM NaPhosphate (pH 6.8). For each mutant, WT SEC curves were plotted in gray for visual comparison. Molecular weights for globular protein standards are shown above each plot. Curves were organized and color-coded to match Figure 1. (B) Diffusion-free sedimentation coefficient distribution c(s) plots for WT and the Pxx mutants at 100 μM protein concentration from SV-AUC experiments. WT is mostly monomeric (dashed line) at this protein concentration, thus making it easier to compare higher order oligomerization states for mutant proteins. (C) Normalized c(s) curves for WT in increasing UBQLN2 protein concentration (10–500 μM). (D) c(s) plots for T487I and P497S mutants over a greater sedimentation coefficient range than used in part B.

