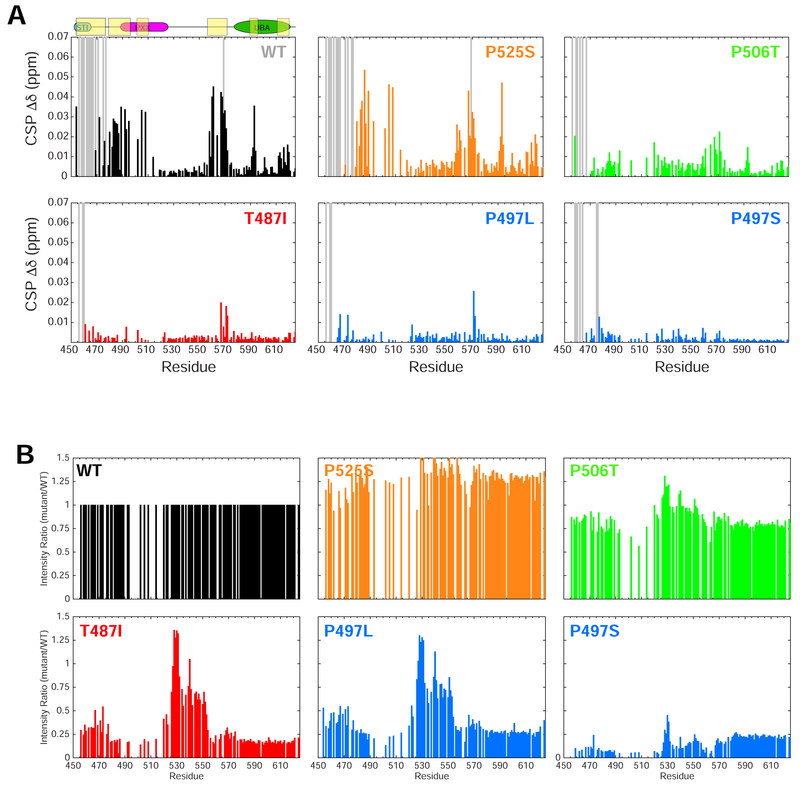
Figure 5. NMR monitors protein concentration-dependent changes on a per-residue basis.
(A) Concentration-dependent CSPs for UBQLN2 (or Pxx mutant as indicated) comparing chemical shifts collected between 50 μM and 350 μM protein concentrations. Gray bars signify those resonances that broaden beyond detection at 350 μM protein concentration. (B) Comparison of amide peak intensities between Pxx mutant and WT using 50 μM protein under identical experimental conditions. All plots are organized and color-coded to match Figures 1 and 3.

