
Figure 3. Legend:
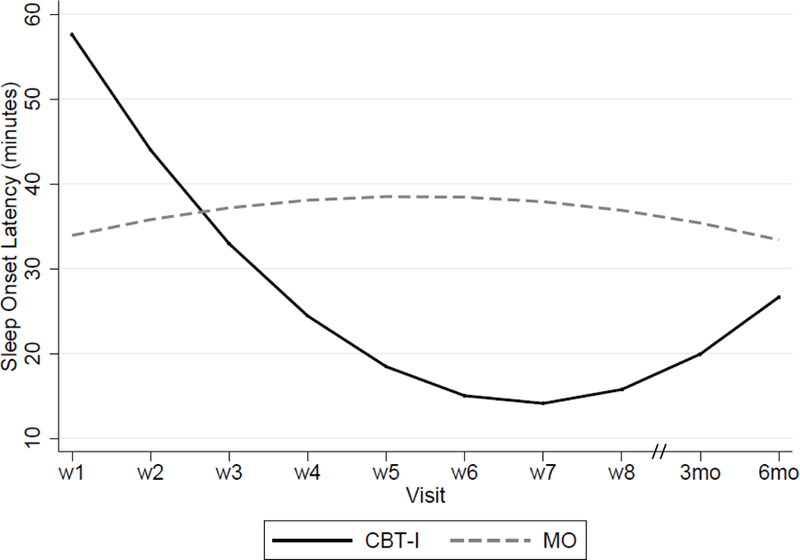
SL = Sleep Latency (from their sleep diaries); wk = week number of visit in the treatment phase; 6 mo. = 6-month post-intervention follow-up visit; model statistics of mixed effects maximum likelihood regression using unstructured covariance matrix and adjusted for Race; time: β = 2.5, p=0.29; treatment: β = 47.7, p = 0.002; treatment x time: β = 1.5, p <0.0001.