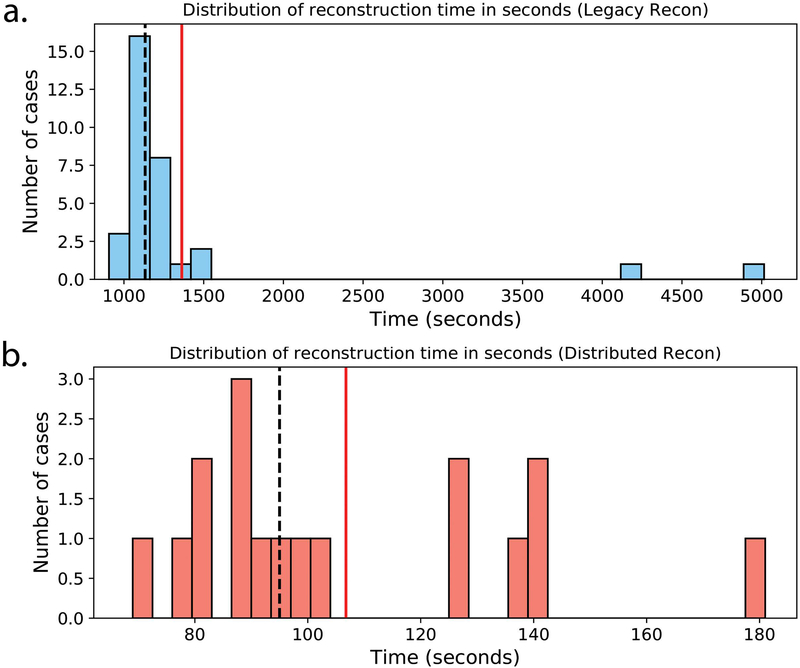
Figure 9.
Histograms of T2Sh reconstruction times in seconds (a) before and (b) after deployment of the optimized reconstruction with distributed processing. Note that the plot scaling differs due to the disparity in reconstruction times. Mean and median reconstruction times are shown with solid red and dashed black lines, respectively.

