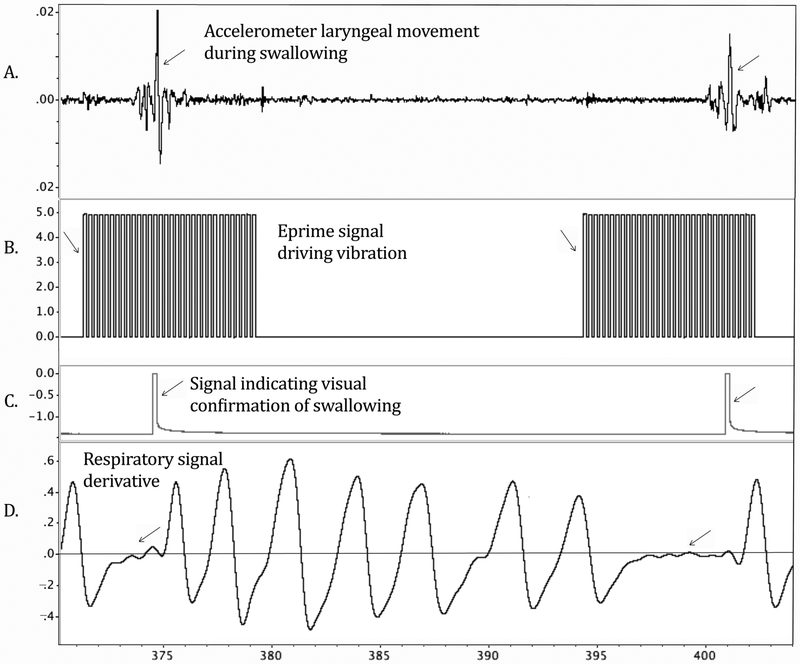
Figure 3.
Illustration of offline analysis of swallow rate in LabChart. A large spike in the accelerometer signal (A) indicated laryngeal elevation at swallowing onset. Eprime software (B) signal indicated vibratory onsets and offsets. The square wave of a pulse generator (C) indicated that the trained observer pushed a button when they visually confirmed a swallow. The first derivative of the sum Inductotrace signal (D) flattened to approximately zero on the y axis, indicating apneic periods during swallowing.

