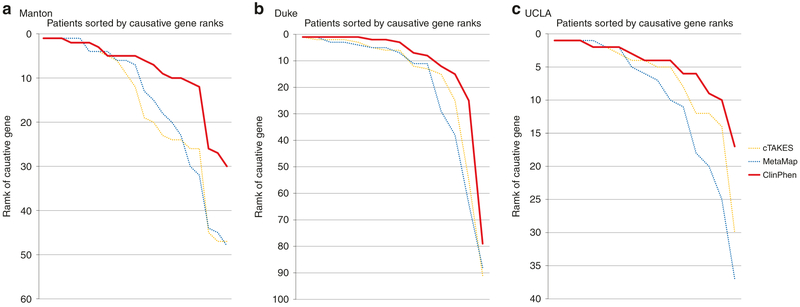
Fig. 4. Replication with patient data from three additional centers.
The same test used to generate Fig. 3c (running Phrank on each patient’s data, given each extracted set of phenotypes, and then sorting the causative gene ranks) was performed using (a) Manton Center patients, (b) Duke Undiagnosed Disease Network (UDN) patients (optical character recognized [OCRed] without manual correction from PDF), and (c) University of California-Los Angeles (UCLA) UDN patients (which had a single consult clinical note per patient) to evaluate the performance of the automatic extractors (ClinPhen, cTAKES, MetaMap). ClinPhen (red line) outperforms other automatic phenotype extractors when its phenotypes are used as input to automatic gene-ranking algorithms (as it did with the Stanford test set).

