
Fig. 1.
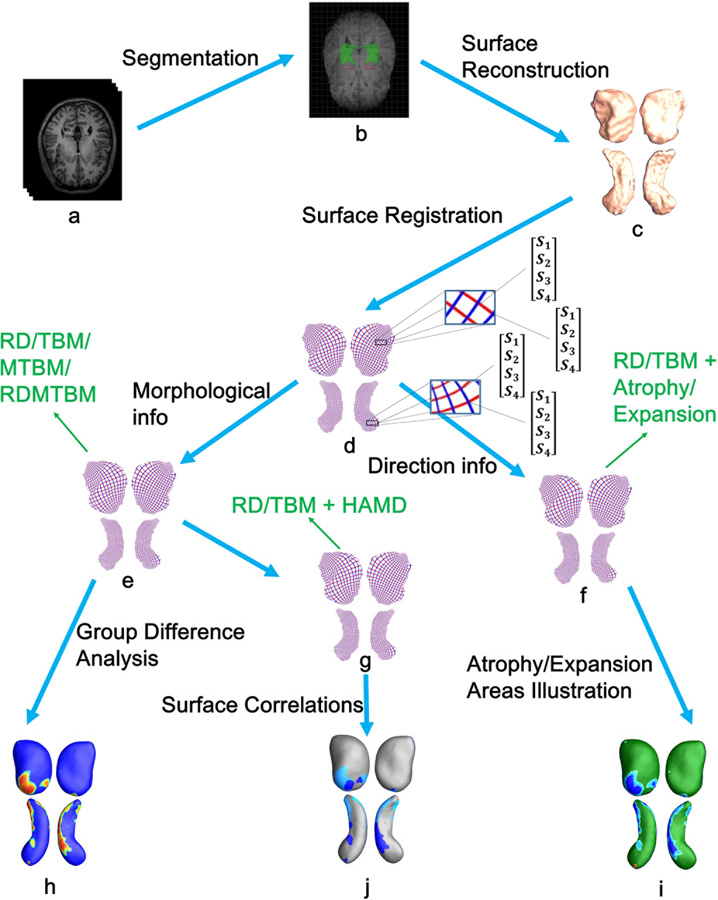
For simplicity, only the surfaces of left amygdala and hippocampus are used for illustration. In the pipeline, letters a—j represent: a T1-MR images; b subcortical structure segmentation; c reconstruction of 3D surface models; d one-to-one correspondence obtained from surface registration; e surface morphological information acquisition; f combine RD/TBM values with atrophy/expansion areas calculated by expression (2) and (3); g combine RD/TBM values with HAMD scores; h group difference analysis; i the atrophy and expansion areas of MDD group versus HC group; j the correlation analysis between each MDD subject’s surface eigenvalues (RD/TBM) and their HAMD scores.