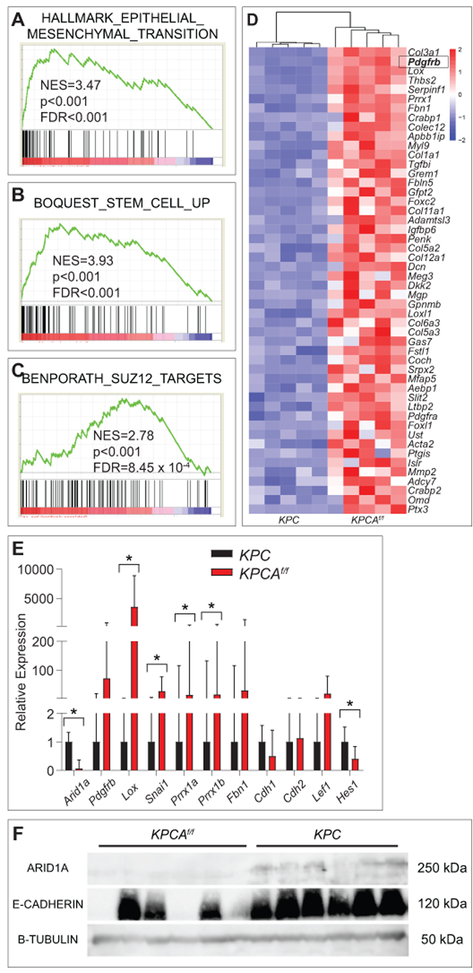
Figure 8.
EMT and stem cell transcriptional programs are activated in Arid1a-mutant PDAC. (A) Gene set enrichment analysis of differentially expressed genes from RNA-Seq of KPC vs KPCAf/f using the “Hallmark” gene sets demonstrates EMT signature is the most enriched signature in KPCAf/f lines. NES=normalised enrichment score; FDR=false discovery rate. (B,C) Gene set enrichment analysis using the “Curated chemical and genetic perturbations” gene sets demonstrates that stem cell and SUZ12 targets are highly enriched in KPCAf/f lines. (D) Expression data of the 50 genes with the highest log2FC between KPCAf/f and KPC cell lines from the gene sets in (A-C) with Pdgfrb highlighted in box. (E) qPCR validation of indicated genes in KPCAf/f (n=8) compared to KPC (n=6) cell lines, *p<0.05. (F) Western blot for ARID1A, E-Cadherin, and B-Tubulin in KPCAf/f and KPC cell lines (n=6 each) shows loss of expression of E-Cadherin in 3 of 6 KPCAf/f cell lines.

