
Figure 2.
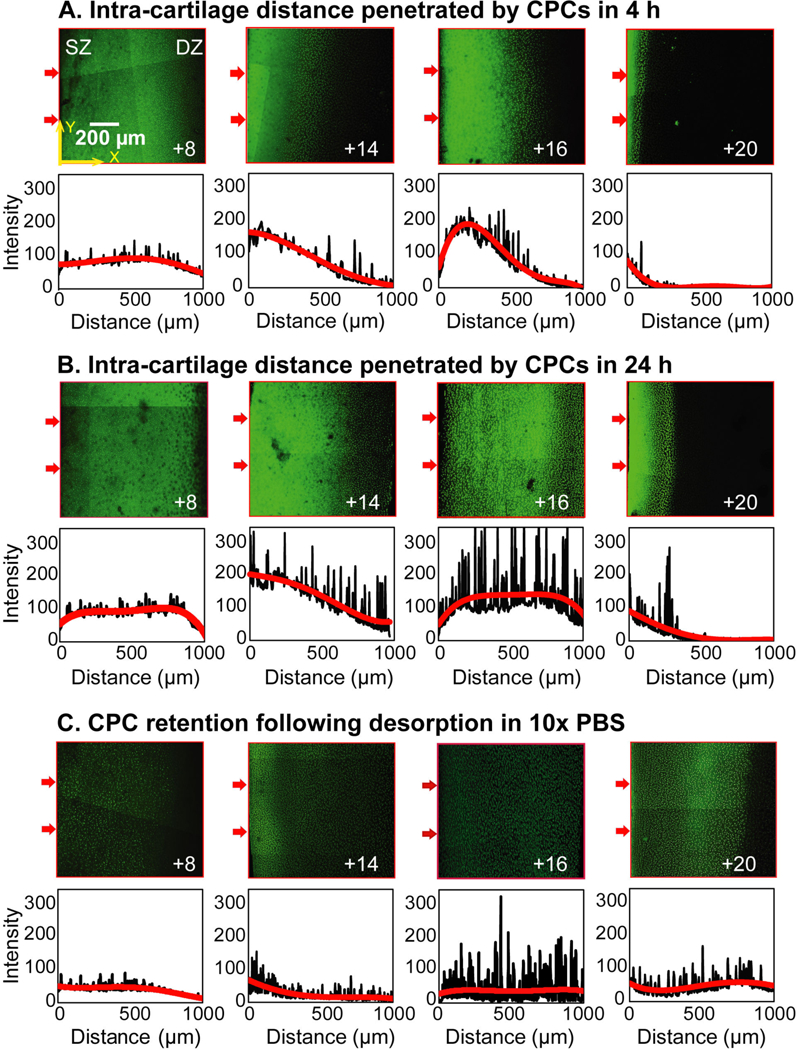
Confocal microscopy images showing intra-cartilage depth of penetration and concentration profiles of CPCs with different net charge (z) from superficial zone (SZ) to deep zone (DZ) in A. 4 h and B. 24 h. C. Confocal microscopy images showing extent of CPC retention and concentration profiles of explants incubated with CPCs for 24 h followed by 24 h desorption in 10x PBS. Arrows on the left side of the images indicate cartilage superficial zone and the direction of CPC penetration. Average fluorescence intensities across the thickness of each slice (X direction) are plotted below the images as a function of distance from the left edge of the images (or cartilage SZ). Scale bar is 200 μm.