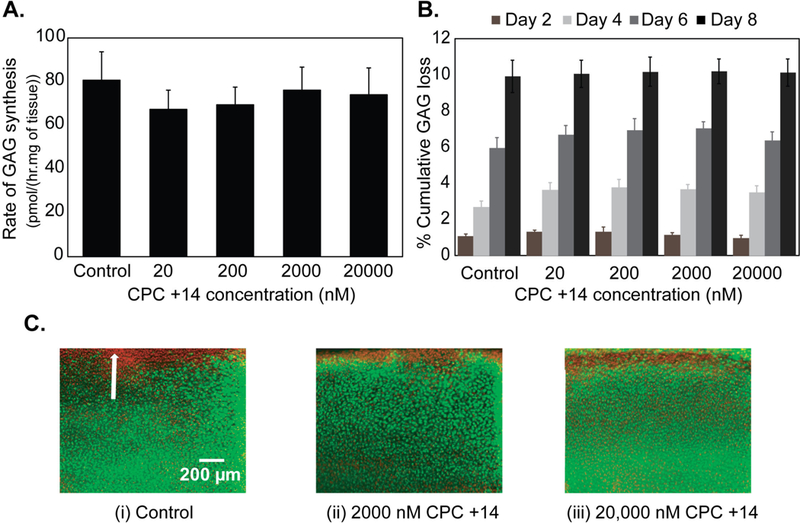
Figure 6.

Dose dependent biological response of CPC +14 in cartilage over a period of 8 days in culture. A. Rate of GAG synthesis, B. % cumulative GAG loss in media, and C. Chondrocyte viability. Green indicates viable cells and red indicates non-viable cells. White arrow shows superficial zone of the tissue.
