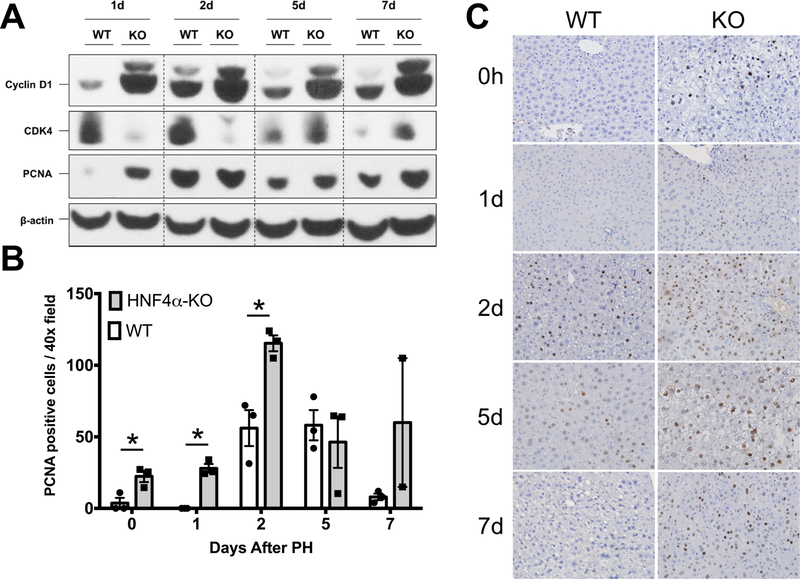
Fig. 4.
Increased hepatocyte proliferation in HNF4α-KO livers throughout regeneration. (A) Western blot analysis of Cyclin D1, CDK4, and PCNA over a time course of 0 to 7 days post-PH. (B) Quantification of immunohistochemical analysis for PCNA positive nuclei in liver sections of WT and HNF4α-KO mice throughout time course post-PH. Bars represent means ± SEM for each group and values from individual mice indicated by black points. (C) Representative photomicrographs (400x) of PCNA-stained liver sections from WT and HNF4α-KO mice throughout time course post-PH. *indicate significant difference at P ≤ 0.05 between WT and HNF4α-KO.

