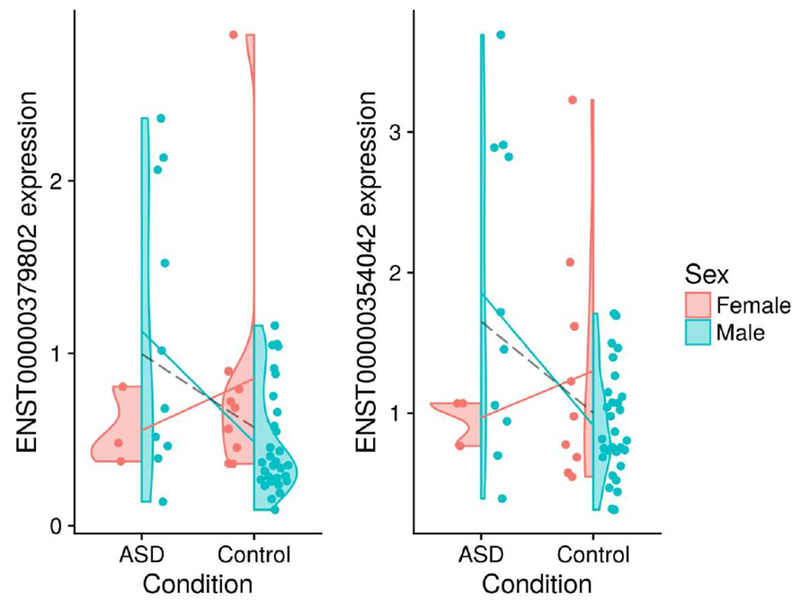
Figure 1:

These violin plots show the base-2 logarithm-transformed expression for the two transcripts with the largest interaction effect from the RNA-Seq data (i.e., those with the smallest corrected p-value). The solid lines show sex-specific mean expression differences. The dashed line shows the sex-independent (i.e., pooled) mean expression difference. The left and right transcripts are associated with the DSP and SLC13A4 genes, respectively.
