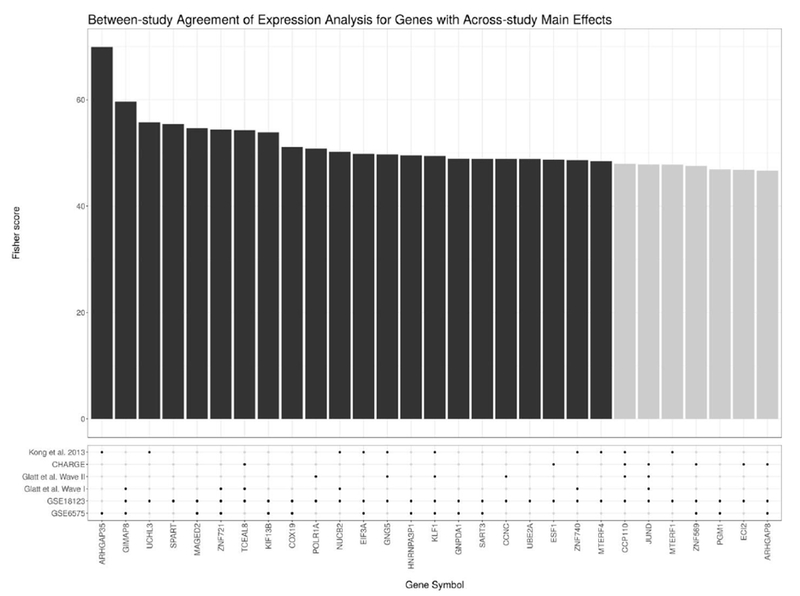
Figure 4:

This figure shows the genes with the most significant sex-independent main effects (i.e., of the ASD condition) according to the meta-analysis of the microarray data. Above, the bar plot shows the χ2 score for each gene as calculated using Fisher’s method (where the dark bars indicate that the gene has an FDR-adjusted p-value < 0.05). Below, the dot plot shows whether a gene showed a nominally significant sex-independent main effect at an unadjusted p-value < 0.05 for a given study. Note that most genes selected for by the meta-analysis show at least nominal significance across multiple studies.
