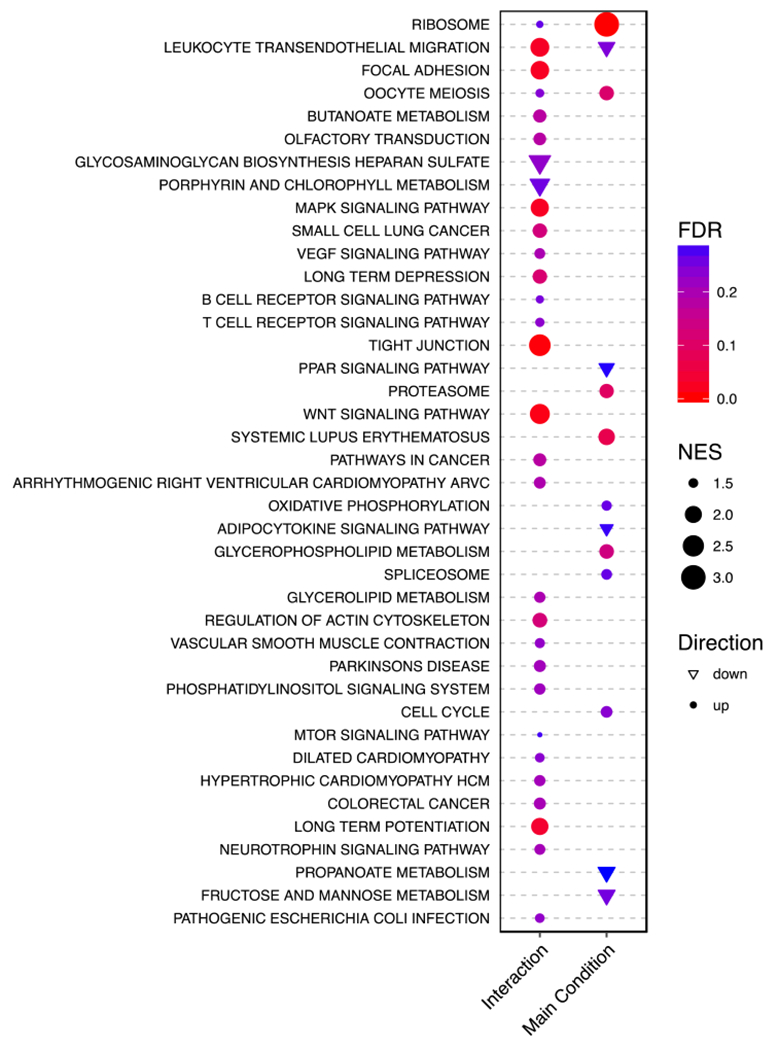
Figure 5:

This dot plot shows results from a GSEA of the RNA-Seq data against the MSigDB KEGG pathways. For the sex-autism interaction and the main effect results, a KEGG pathway (y-axis) has a circle (or triangle) if it is enriched (or depleted). The size of the points indicates the absolute normalised enrichment score. The colour indicates the FDR. Note that only points with an FDR < 0.3 are plotted (see Methods). The enrichment score is defined as the degree to which a gene set is over-represented at the top or bottom of a ranked gene list as calculated by GSEA. The ratio of this to the expected enrichment score of all permutations is the normalised enrichment score (NES).
