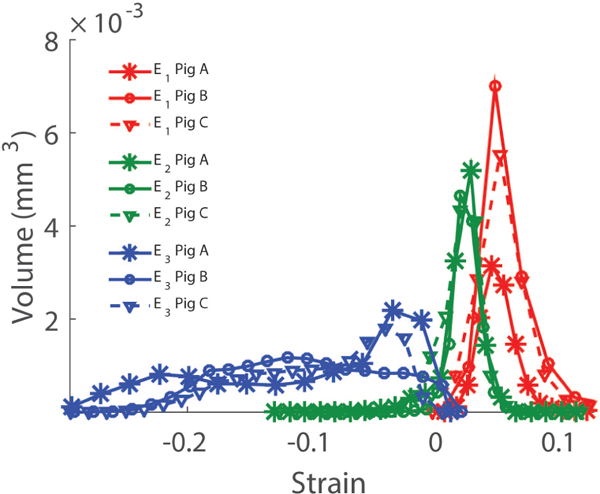
Fig. 10. Histograms of the three LC principal strains computed with DVC at 30mmHg.

The histograms represent the total volume of LC tissue subjected to a given strain level.

The histograms represent the total volume of LC tissue subjected to a given strain level.