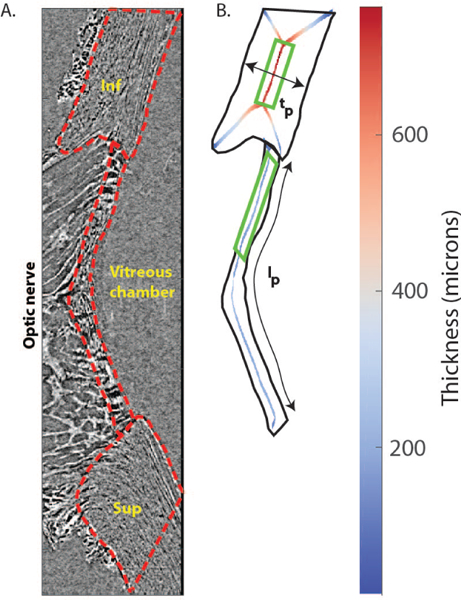
Fig. 2. Tissue thickness calculation from sagittal slices.

A) Sagittal slice passing through the center of the LC and oriented in the superior/inferior direction from the 6 mmHg scan of Pig B. The LC and scleral regions were manually delineated (red lines). B) Binary mask of the inferior sclera and LC. Pixels equidistant to the mask boundary (skeleton) are shown in the inferior sclera and LC, where color represents twice the distance between the centerline and the closest mask edge, i.e. the local thickness. Close to the corners of the sclera and LC, the skeletons have an “X” shape, where the mask boundaries in the anterior-posterior direction disrupt the centerline algorithm. Those regions were not included in the thickness calculation. Scleral and LC thickness were averaged in the indicated green rectangles (the entire scleral region comprised between the X-shaped lines, and the inferior half of the LC). The average thickness was used to compute compressive strain (Eq. 1). The anterior LC length lp was used to compute transverse strain in Eq. 2. Legend: Sup = superior; Inf = inferior.
