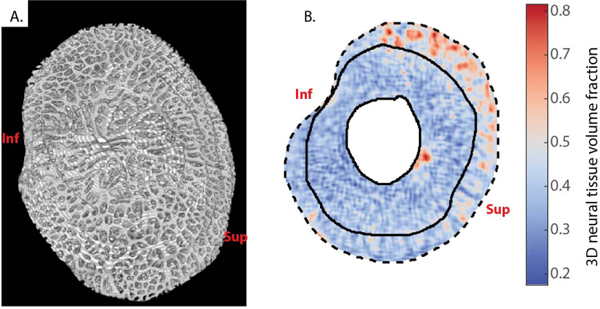
Fig. 5. 3D rendering and neural tissue volume fraction of the LC of Pig B at 6 mmHg IOP.

A) View from the posterior surface of the LC. The pores of the LC are clearly visible, and continuous conduits can be tracked from the anterior face to the posterior face of the LC, confirming the honeycomb-like structure of the porcine LC, although due to the tortuosity of these channels and their variable orientations, they are difficult to completely visualize in this static view. For a rotation of this 3D rendering, see supplementary video. The sclera, postlaminar pial septae of the optic nerve, and prelamina have been excluded from this reconstruction. B) 3D neural tissue volume fraction of the transverse slice shown in Figs. 3A and 4A. The sclera and the central prelaminar tissues are masked. The neural tissue volume fraction was smaller in the LC (delineated with solid lines) than in the pial septae (between the outside solid line and the dashed line, the latter delimiting the margin of the scleral canal). Inf and Sup indicate inferior (Ventral) and superior (Dorsal) orientations, respectively.
