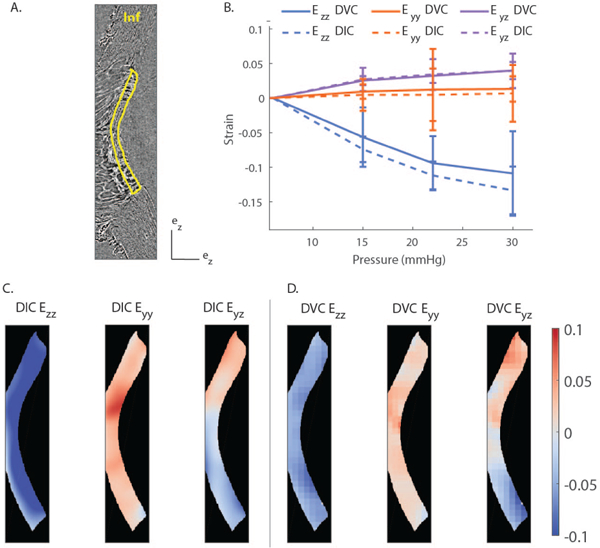
Fig. 8. Comparison of the strains computed by DIC and DVC at 15 mmHg in a sagittal MIP image of the LC of Pig B.

A) PC μCT slice corresponding to the center of the evaluated region. This MIP was close to the center of the LC and oriented in the superior/inferior direction. B) Quantitative comparison of in-plane strain components between DIC and DVC. The strains were averaged over the entire LC, delineated in yellow in panel A, and plotted as a function of the applied pressure. The error bar represent the standard deviation of the strain component over the region of interest. C) Contours of the in-plane strain components calculated by DIC. D) Contours of the in-plane strain components calculated by DVC corresponding to the location of the central slice of the MIP used for DIC analysis in panel C. There was good agreement between the regional variations and averaged values of the strains computed by DIC and DVC. The position of the Inferior pole is shown in panel A.
