Figure 1.

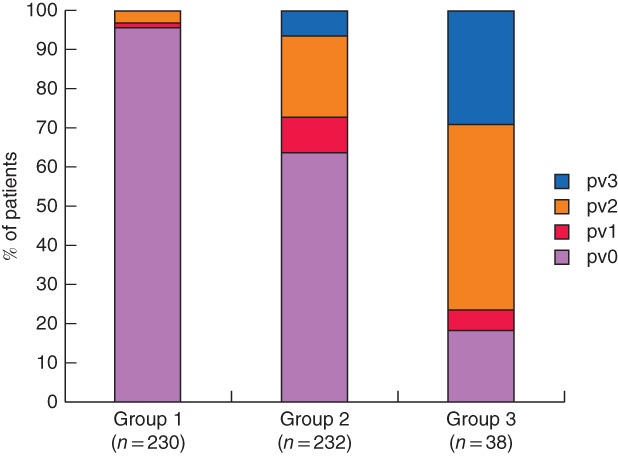
Distribution of pathological portal vein invasion in the three study groups. P < 0·001 (group 1 versus group 2 versus group 3, Kruskal–Wallis test), P < 0·001 (group 2 versus group 3, Mann–Whitney U test)

Distribution of pathological portal vein invasion in the three study groups. P < 0·001 (group 1 versus group 2 versus group 3, Kruskal–Wallis test), P < 0·001 (group 2 versus group 3, Mann–Whitney U test)