
Figure 4.
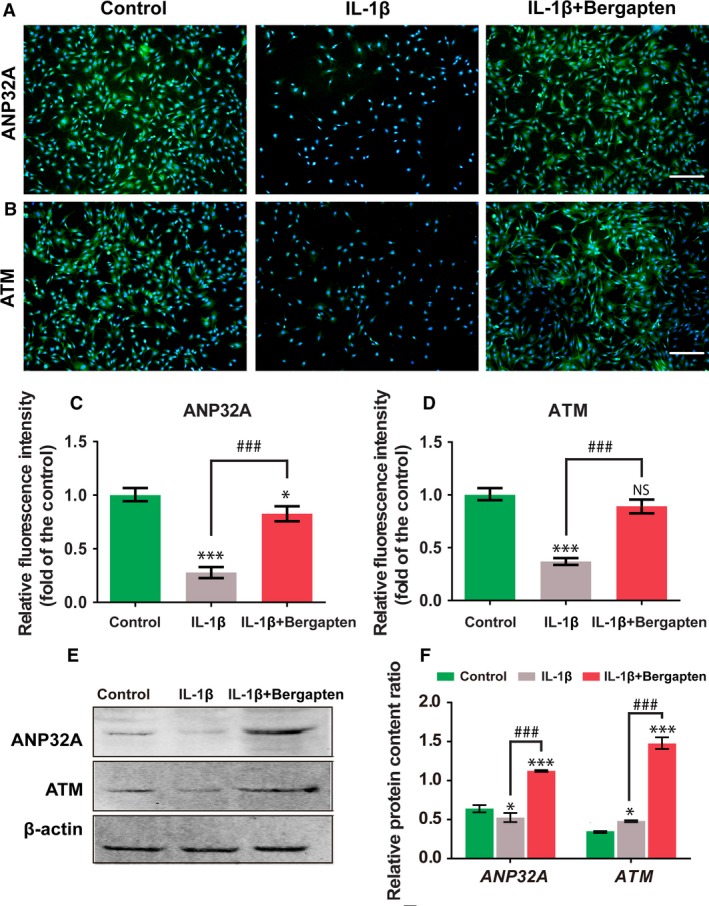
Effect of BG on ANP32A/ATM axis upon IL‐1β stimulation. (A–D) Immunostaining of ANP32A (A) and ATM (B) and relative expression (fold‐change relative to control) (C, D). (E, F) Protein levels of ANP32A and ATM determined by western blot analysis. Control group: chondrocytes treated with vehicle only; IL‐1β group: chondrocytes stimulated with 10 ng·mL−1 IL‐1β; and IL‐1β+BG group: chondrocytes cultured with 10 μm of BG for 1 h then stimulated with 10 ng·mL−1 IL‑1β for 24 h. Scale bars, 400 μm. Mean ± SD, n = 6; *P < 0.05, ***P < 0.001 vs the control group; ### P < 0.001 between the indicated experimental groups; data analysis via one‐way ANOVA and Tukey's test.