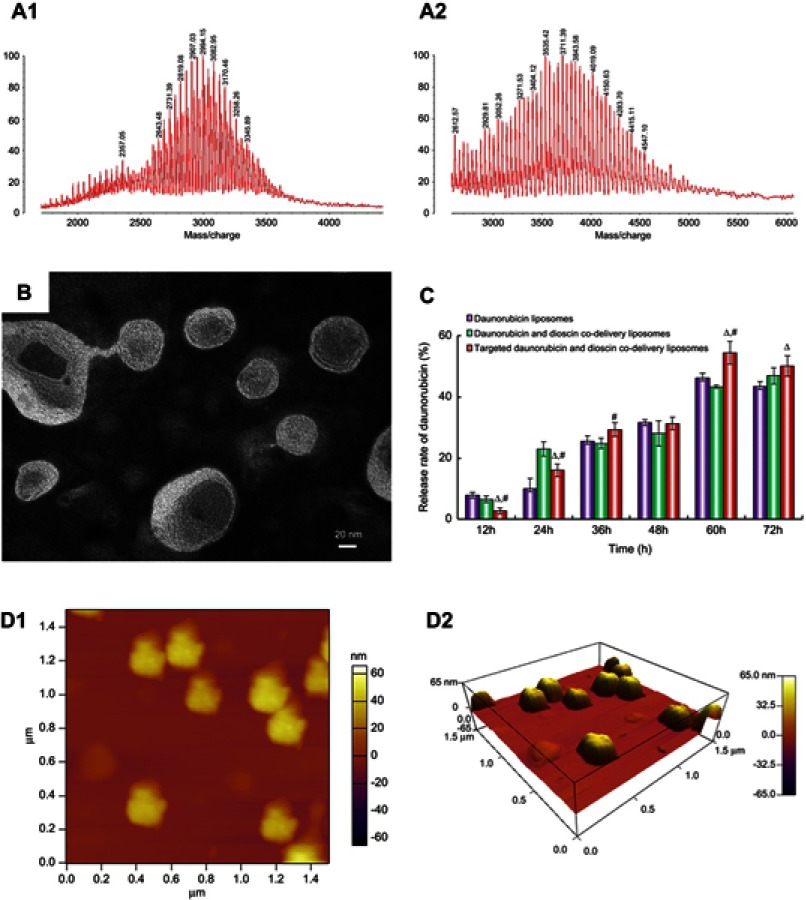
Figure 2.
Characterization of liposomes. (A1) MALDI-TOF-MS spectrum of DSPE-PEG2000-COOH, (A2) MALDI-TOF-MS spectrum of DSPE-PEG2000-PFV, (B) TEM image of targeted daunorubicin and dioscin codelivery liposomes, (C) In vitro cumulative release profile of daunorubicin from varying liposomal formulations. Data are presented as mean ± SD (n=3). △, vs Daunorubicin liposomes; #, vs Daunorubicin and dioscin codelivery liposomes. p<0.05, (D1) AFM image of targeted daunorubicin and dioscin codelivery liposomes, (D2) 3D structure of (D1).
Abbreviations: PFV, PFVYLI; DSPE-PEG2000-COOH, 1,2-distearoyl-sn-glycero-3-phosphoethanolamine-N [carboxy (polyethylene glycol)-2000]; MALDI-TOF-MS, matrix-assisted laser desorption/ionization time-of-flight mass spectrometry; TEM, transmission electron microscope; AFM, atomic force microscope.

