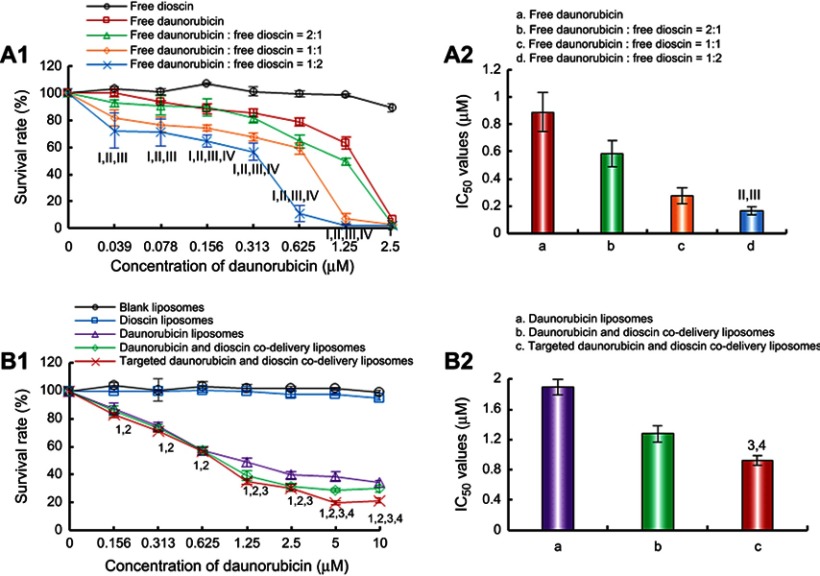
Figure 4.
Inhibitory effects on A549 cells after treatments with the varying formulations. (A) Inhibitory effects of free drugs. I, vs Free dioscin; II, vs Free daunorubicin; III, vs Free daunorubicin: free dioscin=2:1; IV, vs Free daunorubicin: free dioscin=1:1; (B) Inhibitory effects of liposomal formulations. 1, vs Blank liposomes; 2, vs Dioscin liposomes; 3, vs Daunorubicin liposomes; 4, vs Daunorubicin and dioscin codelivery liposomes. Data are presented as mean ± SD (n=6). p<0.05.

