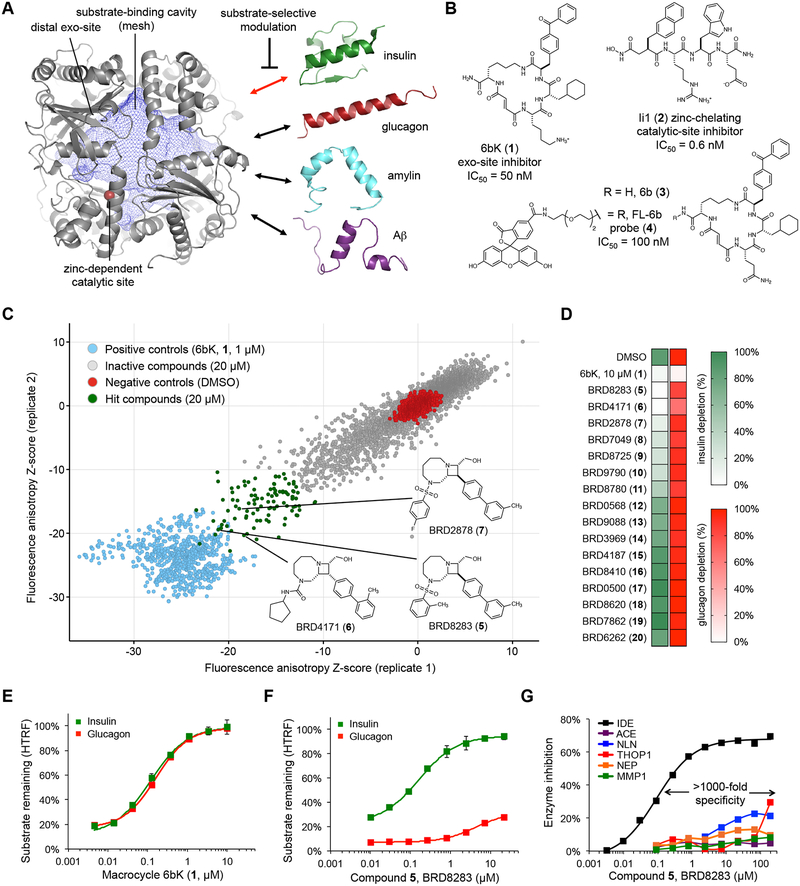
Fig. 1 |. High-throughput screen for IDE exo-site ligands and discovery of substrate-selective IDE inhibitors.
(a) Structure of the primary isoform of IDE(42–1019) comprising four homologous domains that create a large internal cavity (blue mesh)23. The therapeutic outcome of IDE inhibition arises from impeding the degradation of insulin (red double arrow), rather other in vivo IDE substrates (drawn to scale). The red sphere is the bound zinc ion in the catalytic site. (b) Macrocyclic peptide 6bK (1), zinc-chelating peptidic inhibitor Ii1 (2)23, and fluorescent high-throughput screening probe FL-6b (4) based on DNA-templated macrocycle hit 6b (3)11. (c) Small-molecule screen for displacement of FL-6b (4) from human IDE. The X and Y axes show anisotropy Z-scores from two replicates for 7,679 azetidines; see Supplementary Figures 1 and 2 for screening results on all 17,277 compounds tested. Primary assay data and counter-screening results are deposited in PubChem BioAssay databases 1259349 and 1259348, respectively (Supplementary Data Set 1). (d) IDE-mediated insulin versus glucagon depletion (green and red heatmaps, respectively), measured using HTRF with paired labeled antibodies for each substrate in the presence of hit compounds (tested at 67 μM, >10-fold EC50fluo). (e,f) Concentration-dependent profiles for 6bK (1) and BRD8283 (5) in IDE-mediated degradation assays for insulin and glucagon. See also Supplementary Figure 2, for additional substrate degradation assays using 6bK (1), BRD8283 (5), BRD4171 (6) and BRD2878 (7), respectively. (g) Fluorogenic peptide cleavage assays reveal >1,000-fold specificity of BRD8283 (5) for IDE (EC50fluo = 100 nM, IMAX = 65%) over all other metalloproteases tested: thimet oligopeptidase (THOP), neurolysin (NLN), neprilysin (NEP), matrix metalloprotease 1 (MMP1), and angiotensin converting-enzyme (ACE). See also Supplementary Figure 2 for the protease specificity profile of BRD4171 (6, >500-fold specificity). All assays include IDE alone in 2% v/v DMSO as the no-inhibitor activity reference. Points and error bars represent mean ± SEM for three technical replicates (e–f), or two technical replicates in the additional metalloprotease assays (g) and substrate depletion heatmaps (d). EC50 values are reported for endpoint degradation assays and for partial inhibitors, whereas IC50 values are calculated for kinetic assays with normal inhibitors36.

