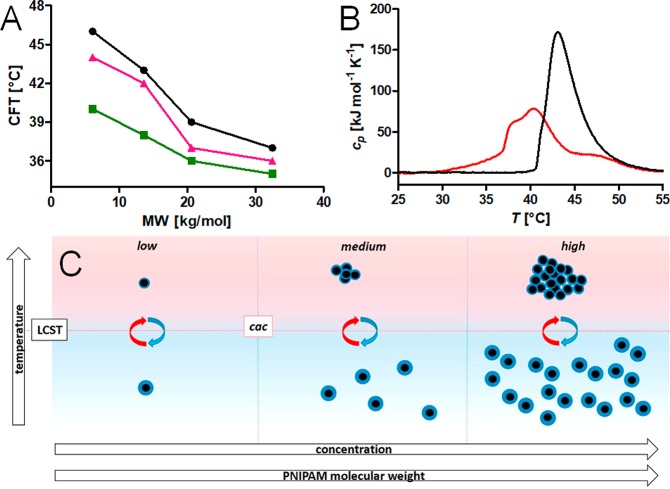
Figure 6.
(A) Summary of the CFT as a function of PiPrOxA MW for free polymer and 9.1 nm iron oxide nanoparticles grafted with PiPrOxA measured in Milli-Q water by DLS as the temperature at which aggregation starts (the onset of the transition in the count rate curve). Black circles, free PiPrOxA (1 g L–1); pink triangles, PiPrOxA-grafted iron oxide nanoparticles (5 × 10¹³ particles mL–1); green squares, PiPrOxA-grafted iron oxide nanoparticles (1 g L–1). (B) DSC curves for 21 kg mol–1 MW PiPrOxA at 1 mg mL–1 for free polymer (black) showing one transition and PiPrOxA grafted to nanoparticles (red), showing multiple transitions. Altered and reprinted with permission under the Creative Commons Attribution 4.0 license for Schroffenegger, M., et al.36 Copyright 2018 MDPI. (C) Schematic phase diagram experimentally demonstrated for iron oxide nanoparticles grafted with PNiPAAm. Reprinted from ref (58). Copyright 2017 with permission from Elsevier.

