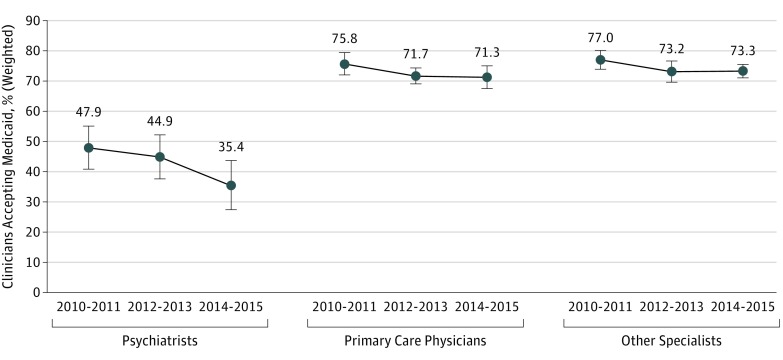
Figure 1. Adjusted Trend Difference in Medicaid Acceptance Across Physician Specialties.
Point estimates are shown as dots; 95% CIs, as lines with bars. Analyses were weighted by the National Ambulatory Medical Care Survey’s national weights and adjusted for practice ownership status (full owner, part owner, employee, or contractor), practice size (solo practice or group practice), practice region (Northeast, Midwest, South, or West), and metropolitan statistical area status (metropolitan, micropolitan, or rural).

