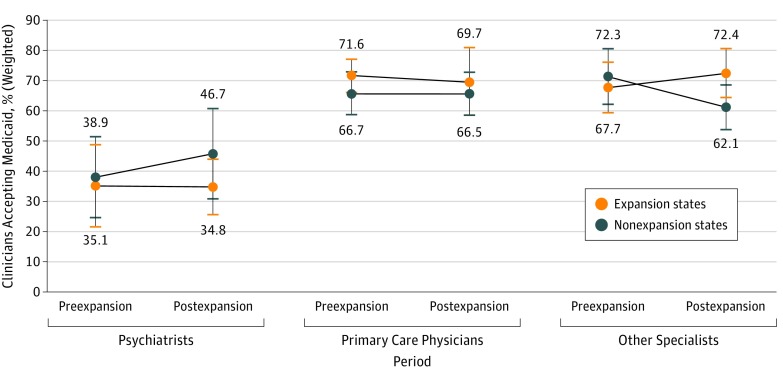
Figure 2. Adjusted Differences in Medicaid Acceptance Before and After Medicaid Expansion Between Expansion and Nonexpansion States and Across Physician Specialties.
Point estimates are shown as colored dots; 95% CIs, as lines with bars. Estimates for the expansion states are in yellow; nonexpansion states, dark blue. Analyses were weighted by the National Ambulatory Medical Care Survey’s national weights and adjusted for individual-level covariates, including practice ownership status (full owner, part owner, employee, or contractor), practice size (solo practice or group practice), and metropolitan statistical area status (metropolitan, micropolitan, or rural); state-level covariates, including rates of comprehensive risk-based Medicaid managed care enrollment, unemployment, and poverty and median household income; and 2-way fixed effects for state and year. Standard errors were clustered at the state level to correct for within-state serial correlation in error terms.

