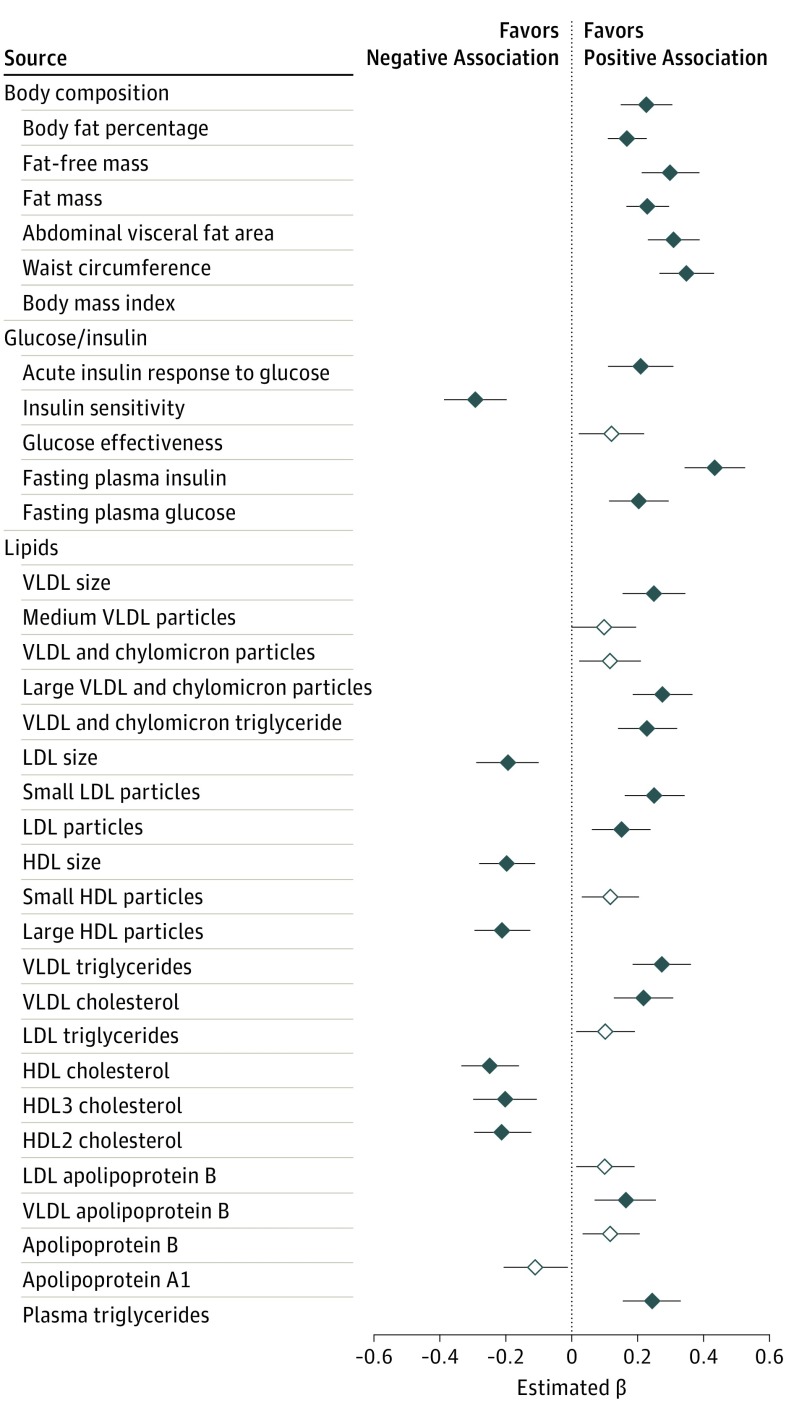
Figure 1. Associations Between Dimethylguanidino Valeric Acid Levels and Baseline Metabolic Traits.
Effect sizes for each clinical trait are reported per SD increment of dimethylguanidino valeric acid levels in a linear regression model adjusted for age and sex. Black bars with solid diamonds meet Bonferroni statistical significance (P < .001); black bars with open diamonds meet nominal significance (P < .05). HDL indicates high-density lipoprotein; LDL, low-density lipoprotein; VLDL, very low-density lipoprotein.

