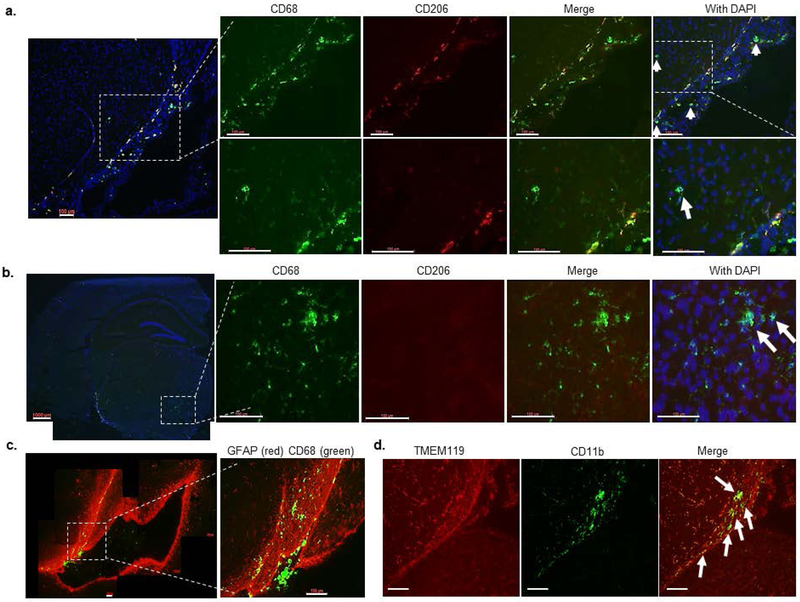
Figure 5.
Myeloid cells infiltrate in different brain regions of C1INH ASO-treated mice. (a) Representative image of the ventricular wall stained for CD68 (green), CD206 (red), and DAPI (blue) shows infiltrating blood-derived cells that are not co-localized with CD206 (white arrows) (scale bar = 100 μm). (b) Representative image of CD68+ cells that are not co-localized with CD206 in the brain parenchyma (scale bar = 100 μm). (c) Representative image for GFAP (red) and CD68 (green) in bregma −2.54 mm of the brain from C1INH ASO-treated mice showing migrating CD68+ cells in the optic tract (scale bar = 100 μm). (d) TMEM119 (red) does not colocalize with CD11b (green) in the optic tract of C1INH ASO-treated mice brain (scale bar = 100 μm).

