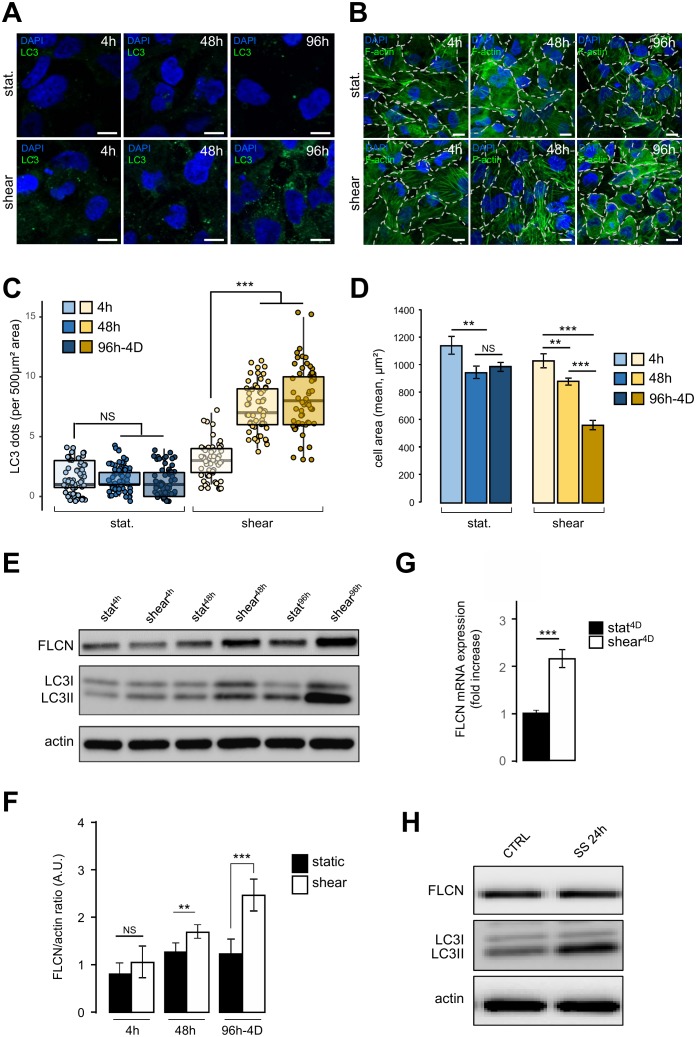
Figure 1. FIGURE 1: Shear stress induces autophagy, cell size decrease and FLCN expression. (A-D).
HK2 cells were subjected to fluid flow from 4 h to 4 days (shear 4 h, 48 h, 96h-4D), or not (static 4 h, 48 h, 96h-4D). (A) After fluid flow treatment or static culture, cells were fixed, labeled with DAPI and immunostained for the autophagosome marker LC3 or stained with phalloidin to reveal F-actin and cell boarders are marked out with white dashes (B) and then analyzed by fluorescence microscopy. (C) Quantification of LC3 puncta (LC3 dots number per 500 μm² area) from experiments shown in (A). (D) Quantification of cell area (mean) from experiments shown in (C). (E-F) HK2 cells were subjected to fluid flow from 4 h to 4 days (shear 4 h, 48 h, 96h-4D), or not (static 4 h, 48 h, 96h-4D). (E) Representative western blot analysis of FLCN, LC3I, LC3II and actin in the indicated conditions. (F) Quantification of Western blot shown in (E). (G) HK2 cells were subjected to 4 days (shear 4D) fluid flow or not (static 4D) and FLCN mRNA expression level was determined and quantified by RT-qPCR. (H) HK2 cells were maintained in normal culture condition (CTRL) or subjected to a 24 h serum starvation (SS 24 h). Levels of the FLCN, LC3I and LC3II were analyzed by western blot. Scale bars in (A) and (C) = 10μm.

