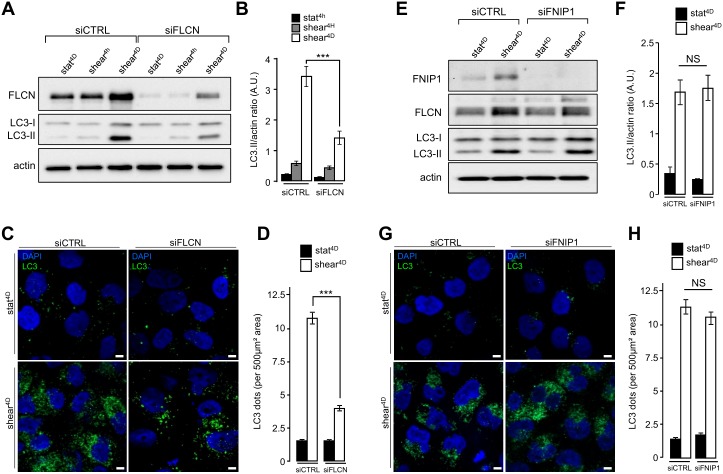
Figure 3. FIGURE 3: FLCN, but not FNIP1, is required for shear stress-induced autophagy.
(A-D) HK2 cells were transfected either with siRNA targeting FLCN (siFLCN) or control siRNA (siCTRL) 72 h later they were subjected to fluid flow (shear) for the indicated times or not (static). (A) Levels of FLCN, LC3I and LC3II were analyzed by western blot and LC3 II/actin ratio was quantified (B). (C) Cells were fixed, labeled with DAPI, immunostained for LC3 and then analyzed by fluorescence microscopy. (D) LC3 dots were quantified from experiments shown in (C). (E-H) HK2 cells were transfected either with siRNA targeting FNIP1 (siFNIP1) or control siRNA (siCTRL). 72 h later they were subjected to fluid flow for 4 days (shear 4D) or not (static 4D). (E) Levels of FNIP1, FLCN, LC3I and LC3II were analyzed by western blot and LC3 II/actin ratio was quantified (F). (G) Cells were fixed, labeled with DAPI, immunostained for LC3 and then analyzed by fluorescence microscopy. (H) LC3 dots were quantified from experiments shown in (G). Scale bars in (C) and (G) = 5μm.

