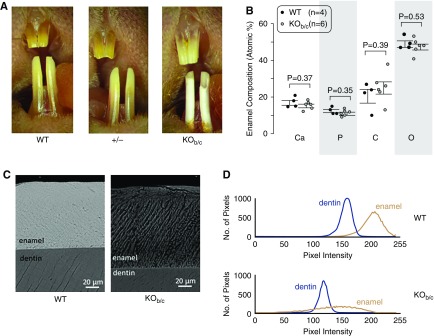
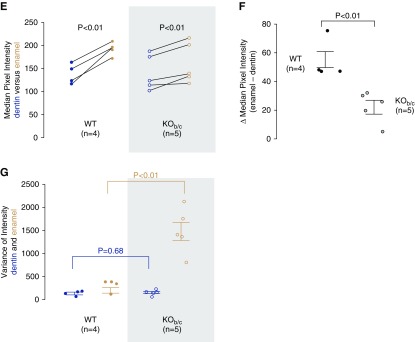
Figure 4.
Nbce1b/c-null (KOb/c) mice exhibit enamel defects. (A) Photographs of the incisors of wild-type (WT), +/−, and KOb/c littermates (representative of more than ten mice each). (B) The results of EDS analysis of the enamel of a greater number of incisors taken from preparations such as those shown in the following panel. Note that a parallel analysis of dentin also showed no significant difference in composition between WT and KOb/c mice (data not shown). (C) Representative electron micrograph of polished cross-sections of incisors from a pair of WT and KOb/c littermates. (D) Representative plots of pixel intensity for dentin and enamel taken from electron micrographs of a WT and KOb/c incisor. Note that the pixel intensities can only be compared between dentin and enamel in the same tooth and not between teeth as the intensity depends on the distance between the electron detector and the sample surface, which was not constant among samples [an exception being the images in (C)]. (E) A comparison of the median pixel intensity of dentin and enamel from a greater number of electron micrographs of WT and KOb/c incisors (one micrograph per tooth). (F) A comparison of the difference in median pixel intensities between dentin and enamel from the same images. (G) Variation of pixel intensity between dentin and enamel from the same images.


