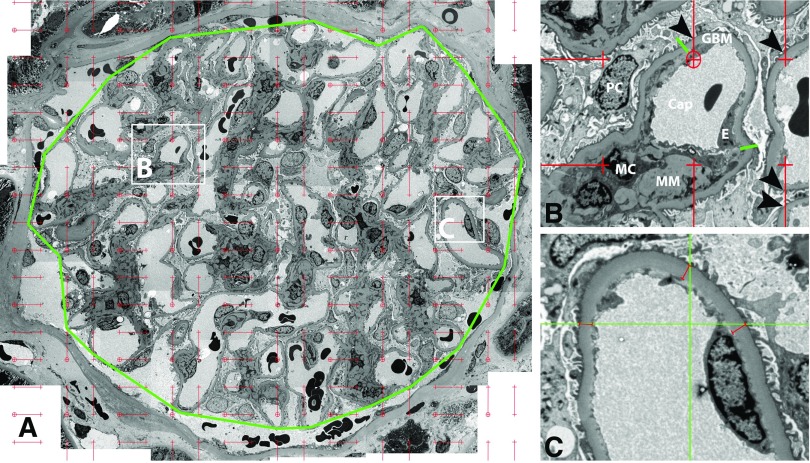
Figure 1.
Morphometric measurements using electron microscopy images. (A) Montage image of a glomerular profile (approximately ×8700 magnification). The outline of the glomerular tuft is marked by a polygon (green) around outer capillary loops. A counting grid composed of short lines (red) connecting fine (crosshairs) and coarse points (circled crosshairs), which are systematically and uniformly distributed is superimposed on the image. The fine points are used to measure the area of mesangium and the coarse points are used to measure the area of the polygon and the ratio of these is Vv(Mes/glom).23,24 Magnified views of B and C squares are shown on the right for details. (B) Two green lines separate peripheral GBM of a capillary loop from mesangial region, comprising mesangial cells (MC) and matrix (MM) (approximately ×32000 magnification). The intercepts between short red lines and peripheral GBM (arrowheads) are counted to estimate Sv(PGBM/glom).23,24 (C) Higher magnification image (approximately ×46000 magnification) taken according to a systematic uniform random sampling protocol used for measurement of GBM width.23,24 Systematically and uniformly distributed grid lines (green) are superimposed on the image. Perpendicular distance from the base of foot processes to the endothelial lining (red lines) are measured wherever grid lines cross the base of foot processes. Cap, capillary; E, endothelial cell; PC, podocyte.

