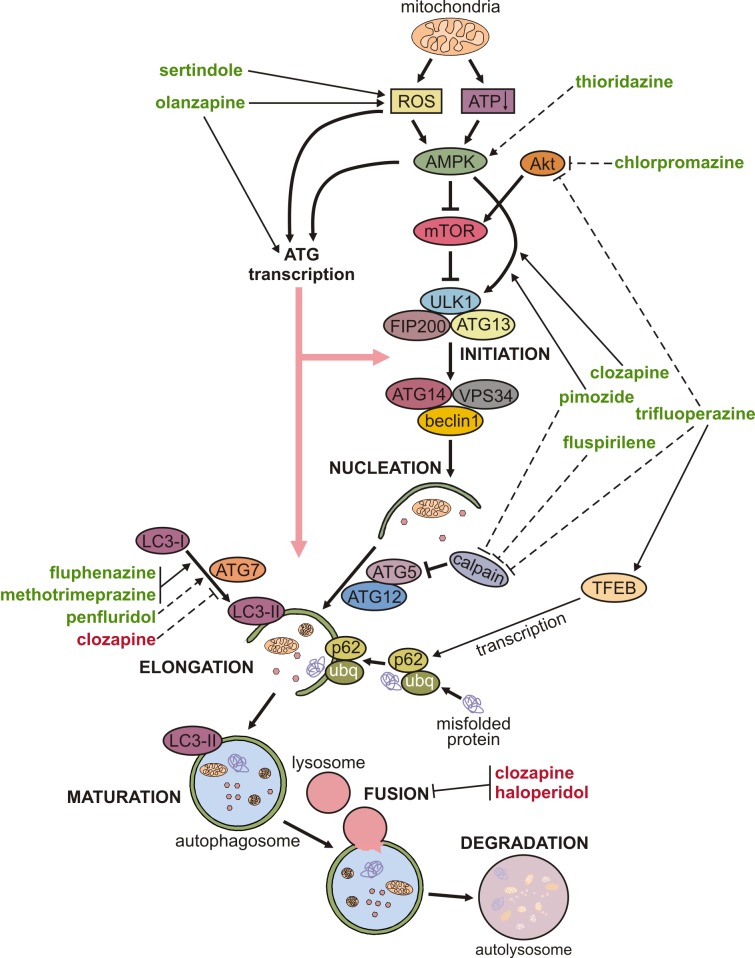
Figure 1. Figure 1: Mechanisms of autophagy regulation by antipsychotics.
A simplified map of autophagy regulation is presented, including the sites of action of antipsychotic drugs shown as arrow-headed (activation/increase) or bar-headed lines (inhibition/decrease). The full and dashed lines refer to modulation in neurons/brain and non-neuronal cells, respectively. The drug names are marked green for autophagy stimulation, or red for autophagy inhibition. Some drugs are shown to directly modulate LC3 conversion only because no specific underlying mechanism was described. (ubq - ubiquitin).

