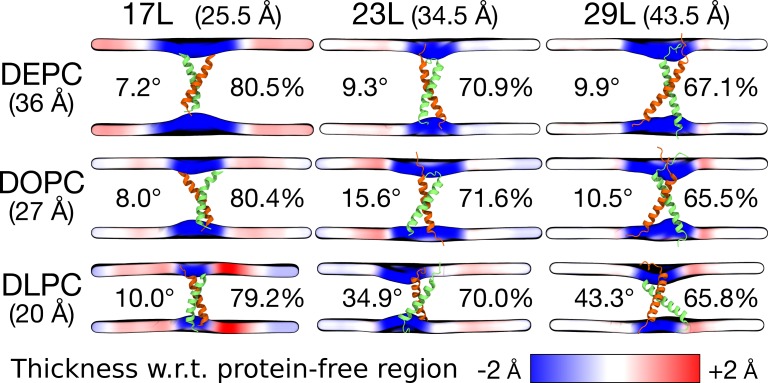
Figure 4. FIGURE 4: Summary of the results from MD simulations of homo-dimers.
The peptide and the membrane are unchanged along the columns and rows, respectively. The hydrophobic length of the peptide and the hydrophobic thickness of the membrane are given in brackets. The two peptides are shown in green and orange, while the mean positions of the phosphorus atoms in lipid head-groups are shown as a surface. This surface is colored according to the value of local average membrane (phosphorus-phosphorus) thickness with respect to (w.r.t.) the bulk membrane thickness far away from the dimer. The thicknesses are calculated from the last 500 ns of the simulations. The average tilt of the peptides is given in degrees and the average alpha-helical content in percentage.

