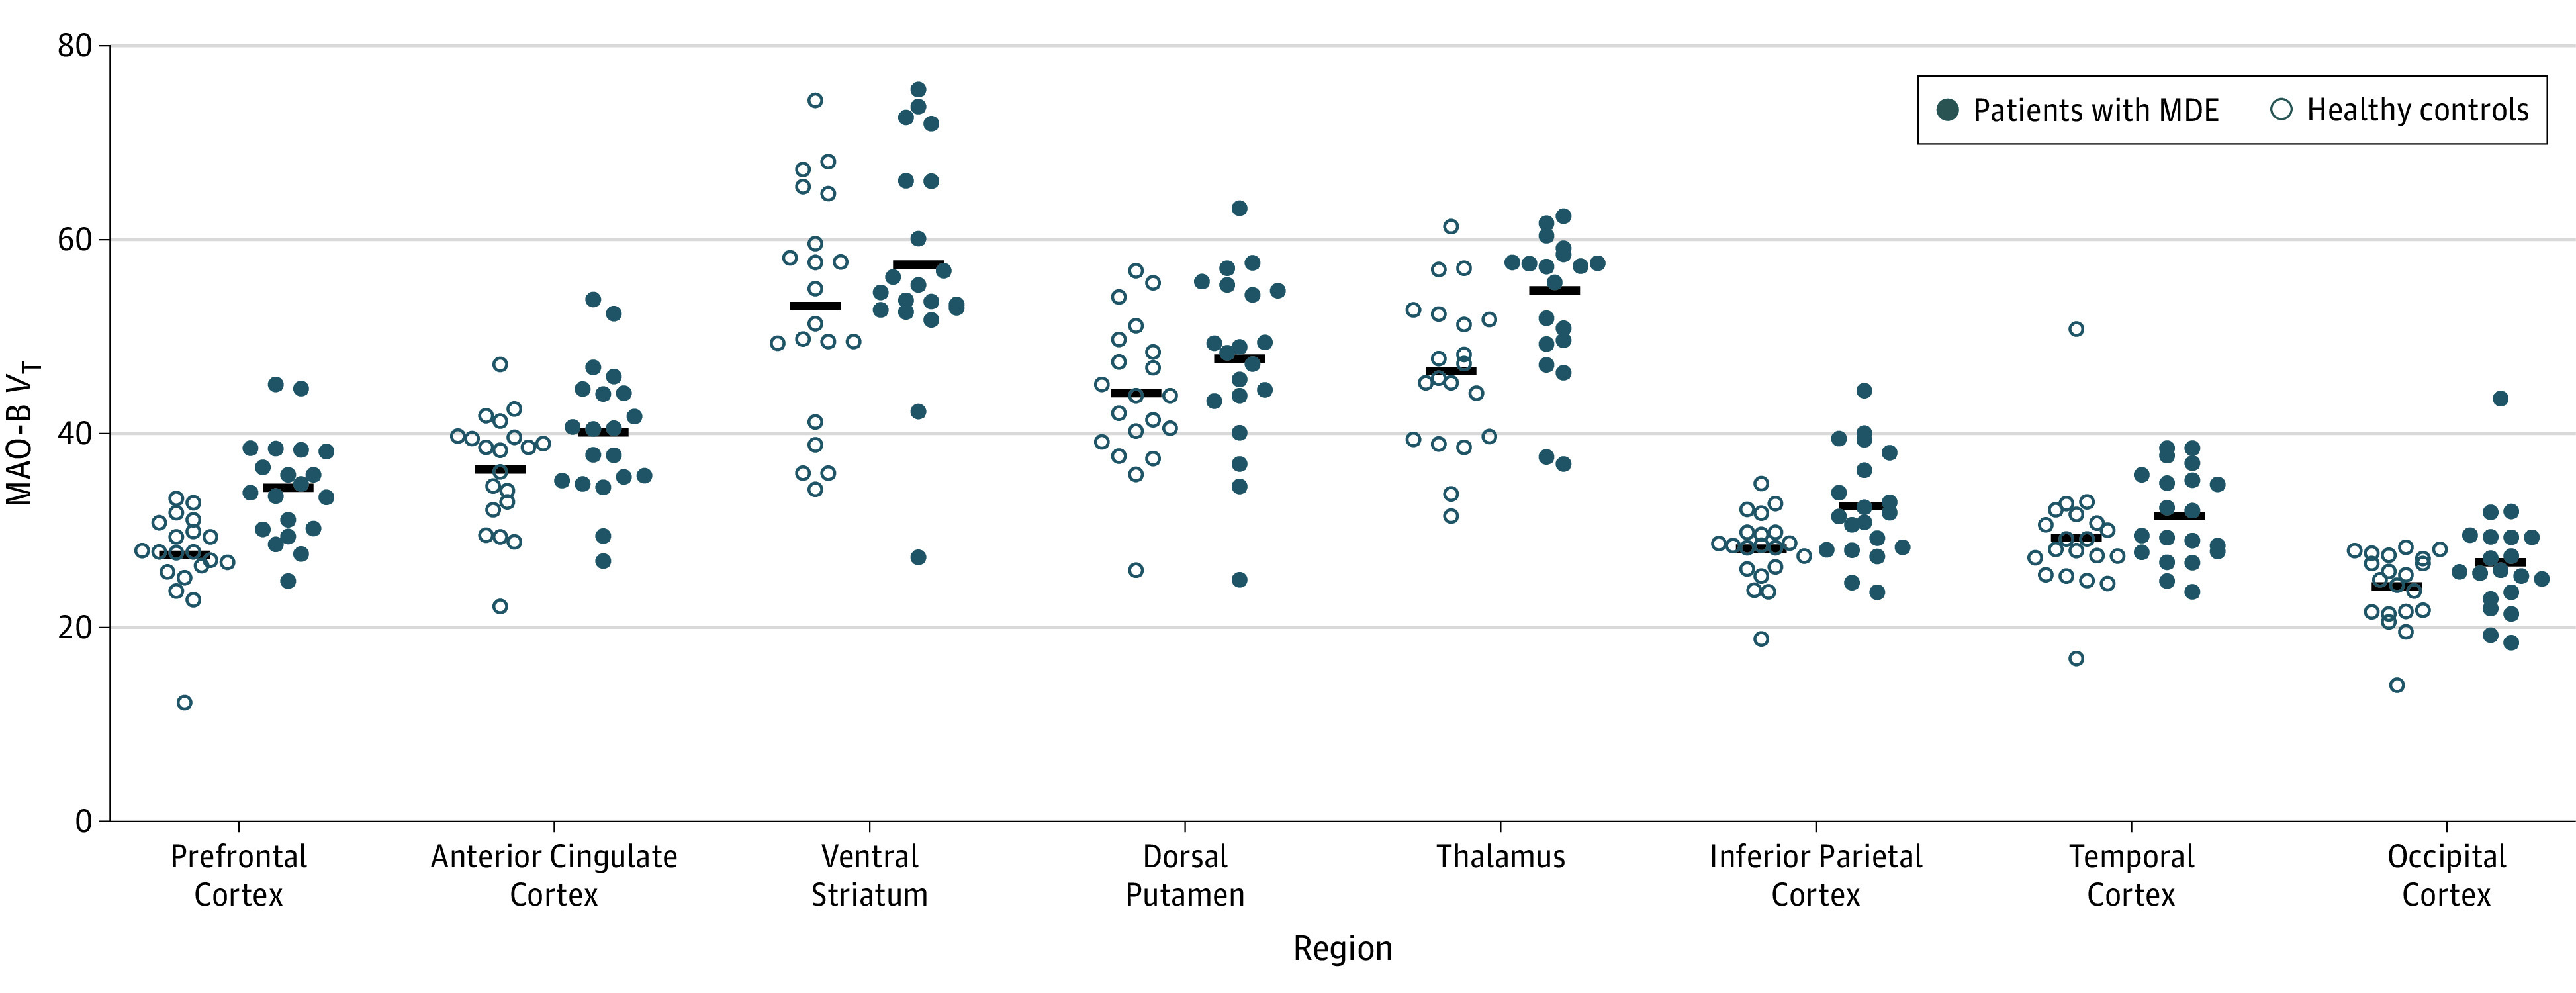
Figure 2. Elevated MAO-B Total Distribution Volume During Major Depressive Episodes (MDEs).

Calculation of analysis of variance resulted in the following interactions of diagnosis with region: prefrontal cortex (F1,38 = 19.6; P < .001), thalamus (F1,38 = 8.8; P = .005), and inferior parietal cortex (F1,38 = 9.0; P = .005). MAO-B indicates monoamine oxidase B; MAO-B VT, MAO-B total distribution volume.
