Fig. 2.

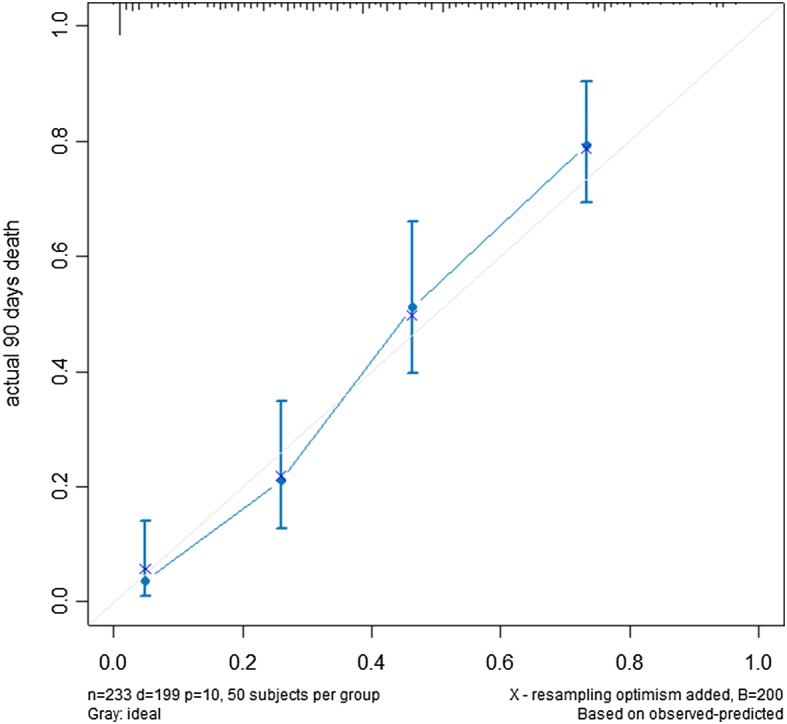
Calibration of the nomogram in the training cohort (n = 247). The x-axis represents the nomogram-predicted survival, and the y-axis represents actual survival and 95% CIs measured by Kaplan-Meier analysis

Calibration of the nomogram in the training cohort (n = 247). The x-axis represents the nomogram-predicted survival, and the y-axis represents actual survival and 95% CIs measured by Kaplan-Meier analysis