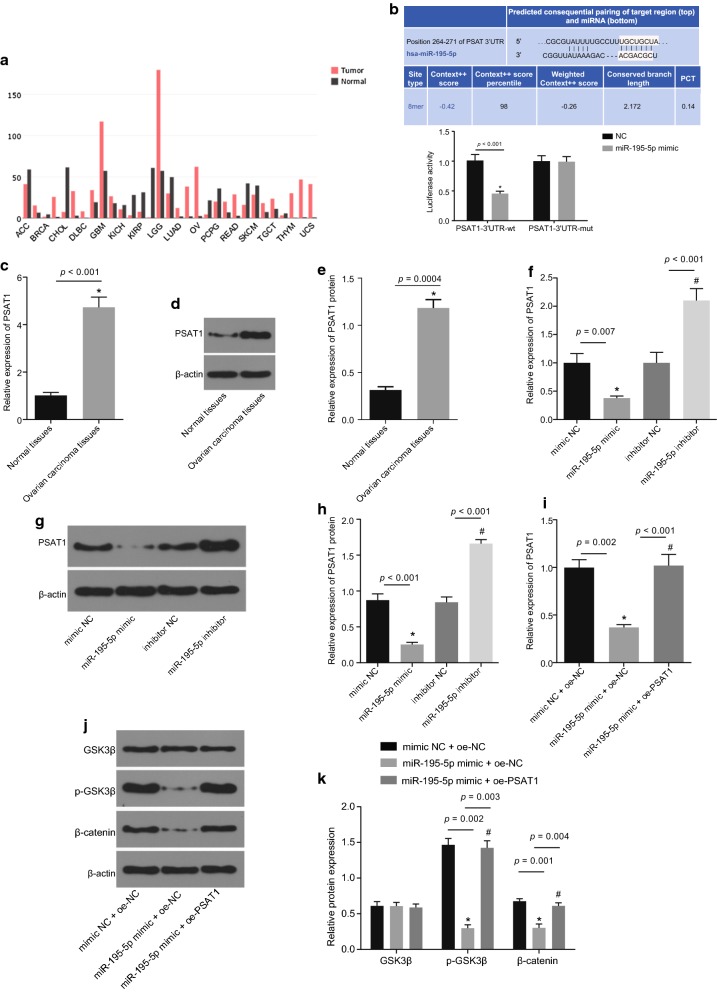
Fig. 4.
Over-expression of miR-195-5p restrains PSAT1 and modulates the GSK3β/β-catenin signaling pathway. a Predicted expression of PSAT1 in tumor and normal tissues in bioinformatics website GEPIA. b Binding of miR-195-5p to PSAT1 predicted by bioinformatics website and verified by dual luciferase reporter gene assay; *p < 0.05 vs. the NC group; c mRNA expression of PSAT1 in adjacent normal tissues (n = 25) and OC tissues (n = 77) determined by RT-qPCR; *p < 0.05 vs. the adjacent normal tissues; d, e protein expression of PSAT1 in adjacent normal tissues (n = 25) and OC tissues (n = 77) detected by Western blot analysis; *p < 0.05 vs. the adjacent normal tissues; f, mRNA expression of PSAT1 in SKOV-3 cells when transfected with miR-195-5p mimic or inhibitor detected by RT-qPCR, n = 3; *p < 0.05 vs. the mimic NC group; #p < 0.05 vs. the inhibitor NC group. g, h Protein expression of PSAT1 in SKOV-3 cells when transfected with miR-195-5p mimic or inhibitor detected by Western blot analysis; *p < 0.05 vs. the mimic NC group; #p < 0.05 vs. the inhibitor NC group; i mRNA expression of PSAT1 in SKOV-3 cells when transfected with miR-195-5p mimic or co-transfected with miR-195-5p mimic and oe-PSAT1 measured by RT-qPCR. *p < 0.05 vs. the mimic NC + oe-NC group; #p < 0.05 vs. the miR-195-5p mimic + oe-NC group; j, k protein expression of GSK3β and β-catenin as well as the extent of GSK3β phosphorylation in SKOV-3 cells when transfected with miR-195-5p mimic or co-transfected with miR-195-5p mimic and oe-PSAT1 measured by Western blot analysis; *p < 0.05 vs. the mimic NC + oe-NC group; #p < 0.05 vs. the miR-195-5p mimic + oe-NC group. The above data are measurement data and expressed by mean ± standard deviation; unpaired t-test is used to analyze the data between two groups, while one-way ANOVA is used to analyze the data among multiple groups; the experiment was independently repeated three times

